Clinical trial recruitment tracking software records how many participants each site has referred, screened, consented and randomised, then shows those numbers against target in real time. It turns a recruitment update from a figure someone types into an email once a week into a live operational picture the whole study team reads from the same source.
Recruitment is the single activity that decides whether a study finishes on time. A trial that misses its enrolment target runs longer, costs more, and sometimes closes without answering its question. The problem is rarely a lack of effort at site level. The problem is that the people responsible for the study often see recruitment late, in aggregate, and without the detail needed to act. A clinical trial management system closes that gap by tracking enrolment at the point each participant moves through the screening funnel, not days afterwards.
This guide explains what recruitment tracking actually measures, why weekly email updates fail busy sites, which metrics a study team should watch, and how a CTMS gives real-time enrolment visibility across every participating site.
Key Takeaways
- Recruitment tracking is operational data, not recruitment strategy. It measures movement through the screening funnel, site by site, against a target.
- Weekly email counts are already out of date when they arrive. A live CTMS shows the current position and the reason behind each screen failure.
- Per-site targets matter more than a study total. One strong site can hide three that have stalled.
- The screen-fail reason is the most useful field on the screening log. It tells the team whether the protocol, the population, or the process is the constraint.
- Real-time visibility supports sponsor oversight under ICH-GCP E6(R3), which expects proportionate, risk-based monitoring of trial conduct.
What Does Recruitment Tracking Actually Measure?
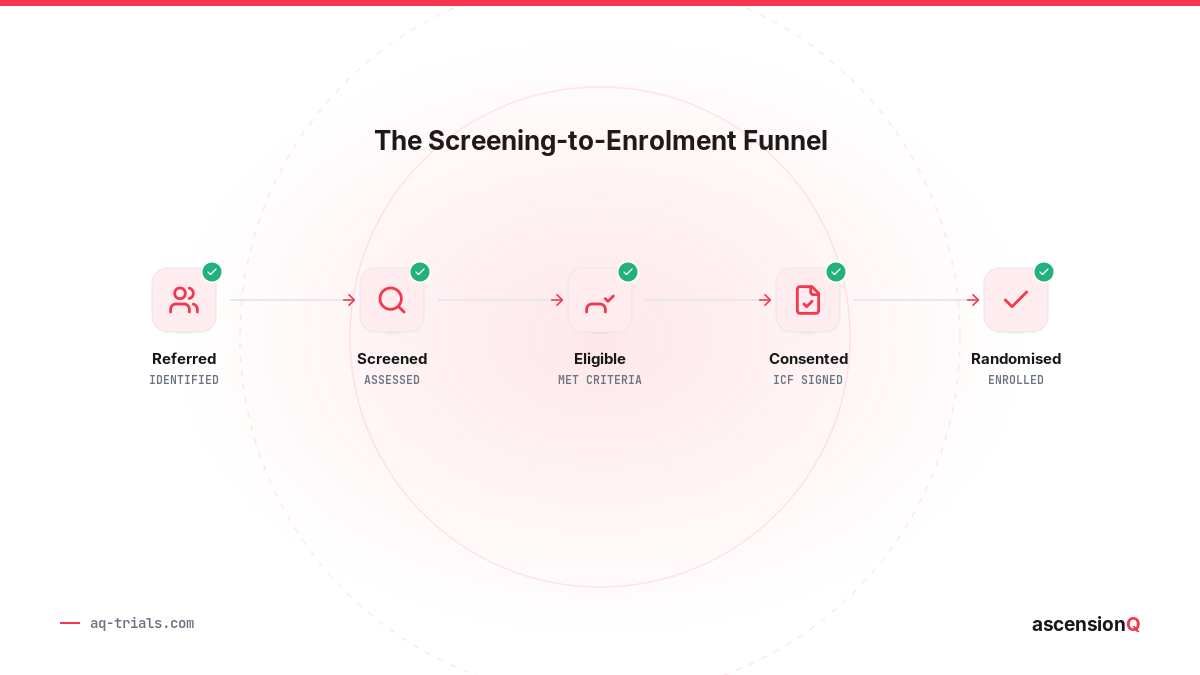
Recruitment tracking follows each potential participant through a defined sequence of stages known as the screening funnel. Every stage records a smaller number than the one before it, and the shape of that funnel tells the study team where participants are lost.
The stages are consistent across most interventional studies, even when the terminology varies by protocol.
| Funnel stage | What it records | Why it matters |
| Referred / identified | Potential participants flagged from clinic lists, databases or self-referral | Shows whether the site has a pipeline at all |
| Pre-screened | A first check against headline eligibility before consent | Filters obvious non-matches early and protects clinic time |
| Screened | Formal eligibility assessment against inclusion and exclusion criteria | The point where most participants are gained or lost |
| Eligible | Participants who met every criterion | Reveals how tight the protocol is against the real population |
| Consented | Informed consent taken and documented | Confirms ethical and regulatory steps are complete before any study activity |
| Enrolled / randomised | Participant entered into the study and, where relevant, allocated | The figure that counts towards the recruitment target |
A recruitment tracker holds a live count at each stage, per site, with the dates and the reason attached to every drop-off. The randomised figure is the one that reaches the target. The stages above it explain how the site got there.
Why Do Weekly Recruitment Updates Fail Sites?
Many study teams still run recruitment on a weekly report. A research nurse counts the week’s activity from a paper screening log, types the totals into a spreadsheet, and emails it to the coordinating team on a Friday. The coordinating team merges several of these spreadsheets into a master, and a study manager reads the combined figure the following week.
Every step in that chain adds delay and removes detail. Consider a study running across eight NHS sites.
- The figure is old before it lands. A number counted on Monday and emailed on Friday describes a position that has already moved by the time the study manager reads it.
- Screen failures arrive as a total, not a reason. A spreadsheet cell that says “6 screen fails” hides whether the cause was an ineligible population, a protocol criterion, or a booking problem.
- One strong site masks several weak ones. A healthy study total can sit on top of three sites that have enrolled nobody for a month.
- There is no audit trail. A figure typed into a spreadsheet and overwritten next week leaves no record of who changed what, or when.
- Reconciliation replaces action. The coordinating team spends its time chasing and merging numbers rather than responding to the sites that need help.
The recruitment problem is visible for a week before anyone with the authority to act can see it.
This is the same structural weakness that affects capacity planning on spreadsheets. The record exists, but it is a snapshot rather than a control. Our guide on CTMS versus spreadsheets for site capacity planning covers that failure mode in detail.
Reactive Counting vs Real-Time Visibility
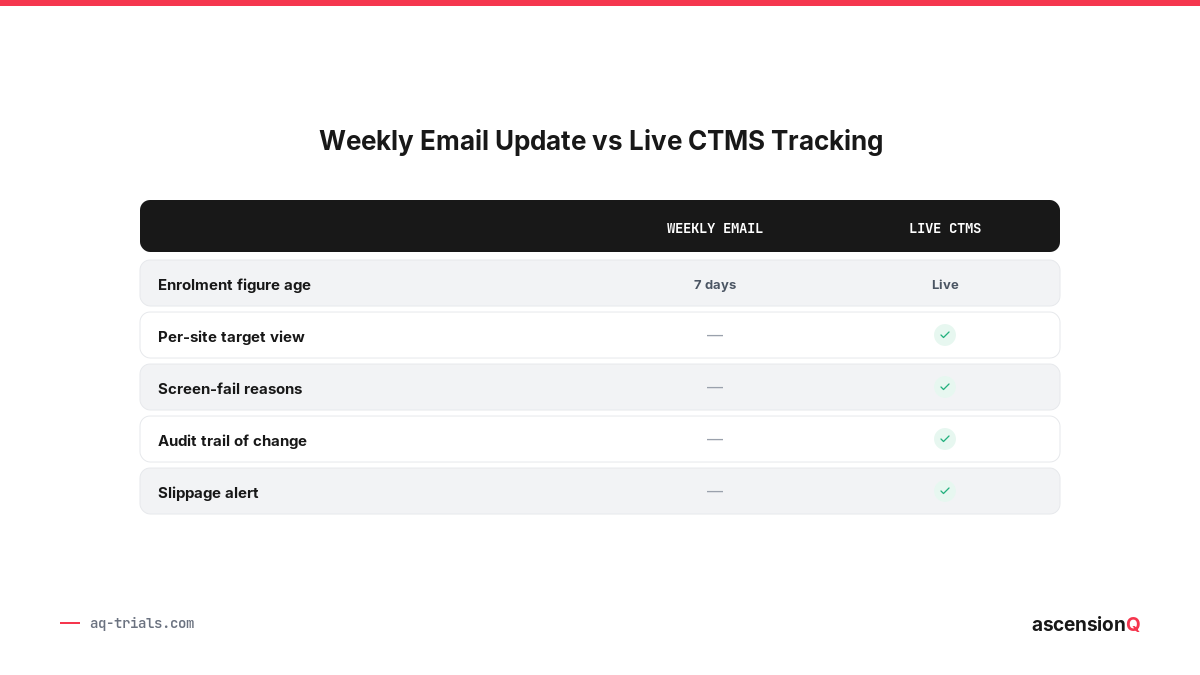
The difference comes down to timing rather than effort. Both models involve committed teams. What separates them is when the information becomes available and how much of it survives the journey to the person who can act.
| Aspect | Weekly email count | Live CTMS tracking |
| Currency of the figure | Up to seven days old | Updated as each participant moves stage |
| Per-site detail | Merged into a study total | Every site visible against its own target |
| Screen-fail reasons | Recorded as a number | Captured as a coded reason on each record |
| Change history | Overwritten weekly | Full audit trail of every entry |
| Slippage warning | Noticed after the fact | Flagged the moment a site falls behind pace |
| Team effort | Spent reconciling spreadsheets | Spent acting on the sites that need support |
Also Read: What is a Clinical Trial Management System (CTMS)?
Which Recruitment Metrics Should a Study Team Track?
A useful recruitment dashboard shows more than a running total. Each metric below states a mechanism and the decision it supports.
- Enrolment against target, per site. The system compares each site’s randomised count to its planned figure for the date, which shows at a glance which sites are ahead, on pace, or behind.
- Screening ratio. The tracker divides participants screened by participants enrolled, which reveals how much screening effort each enrolment costs and flags a protocol that is harder to meet than planned.
- Screen-fail reasons. The system groups failures by coded reason, which tells the team whether to adjust site training, revisit a criterion with the sponsor, or accept the population as the limit.
- Recruitment rate over time. The dashboard plots enrolments per week, which distinguishes a slow start that is accelerating from a site that has genuinely stalled.
- Time from referral to consent. The tracker measures how long participants spend in the funnel, which exposes booking or capacity bottlenecks that lose eligible people.
- Projected completion date. The system extends the current rate to a finish date, which turns a vague concern into a specific decision about adding sites or extending timelines.
These measures map closely to the national focus on delivering studies to time and target, and to the proportionate monitoring of trial conduct that UK good clinical practice guidance expects. A live tracker makes that performance visible while there is still time to influence it.
How Does a CTMS Track Enrolment Across Multiple Sites?
Multi-site studies are where real-time tracking earns its place. A single site can hold its numbers in its head. A study across eight sites, or a contract research organisation running several studies at once, cannot. The coordinating team needs one view that rolls every site up to a study total and drills back down to a single participant.
A CTMS gives that view because every site enters recruitment data into the same structured system rather than a local spreadsheet. The mechanics matter.
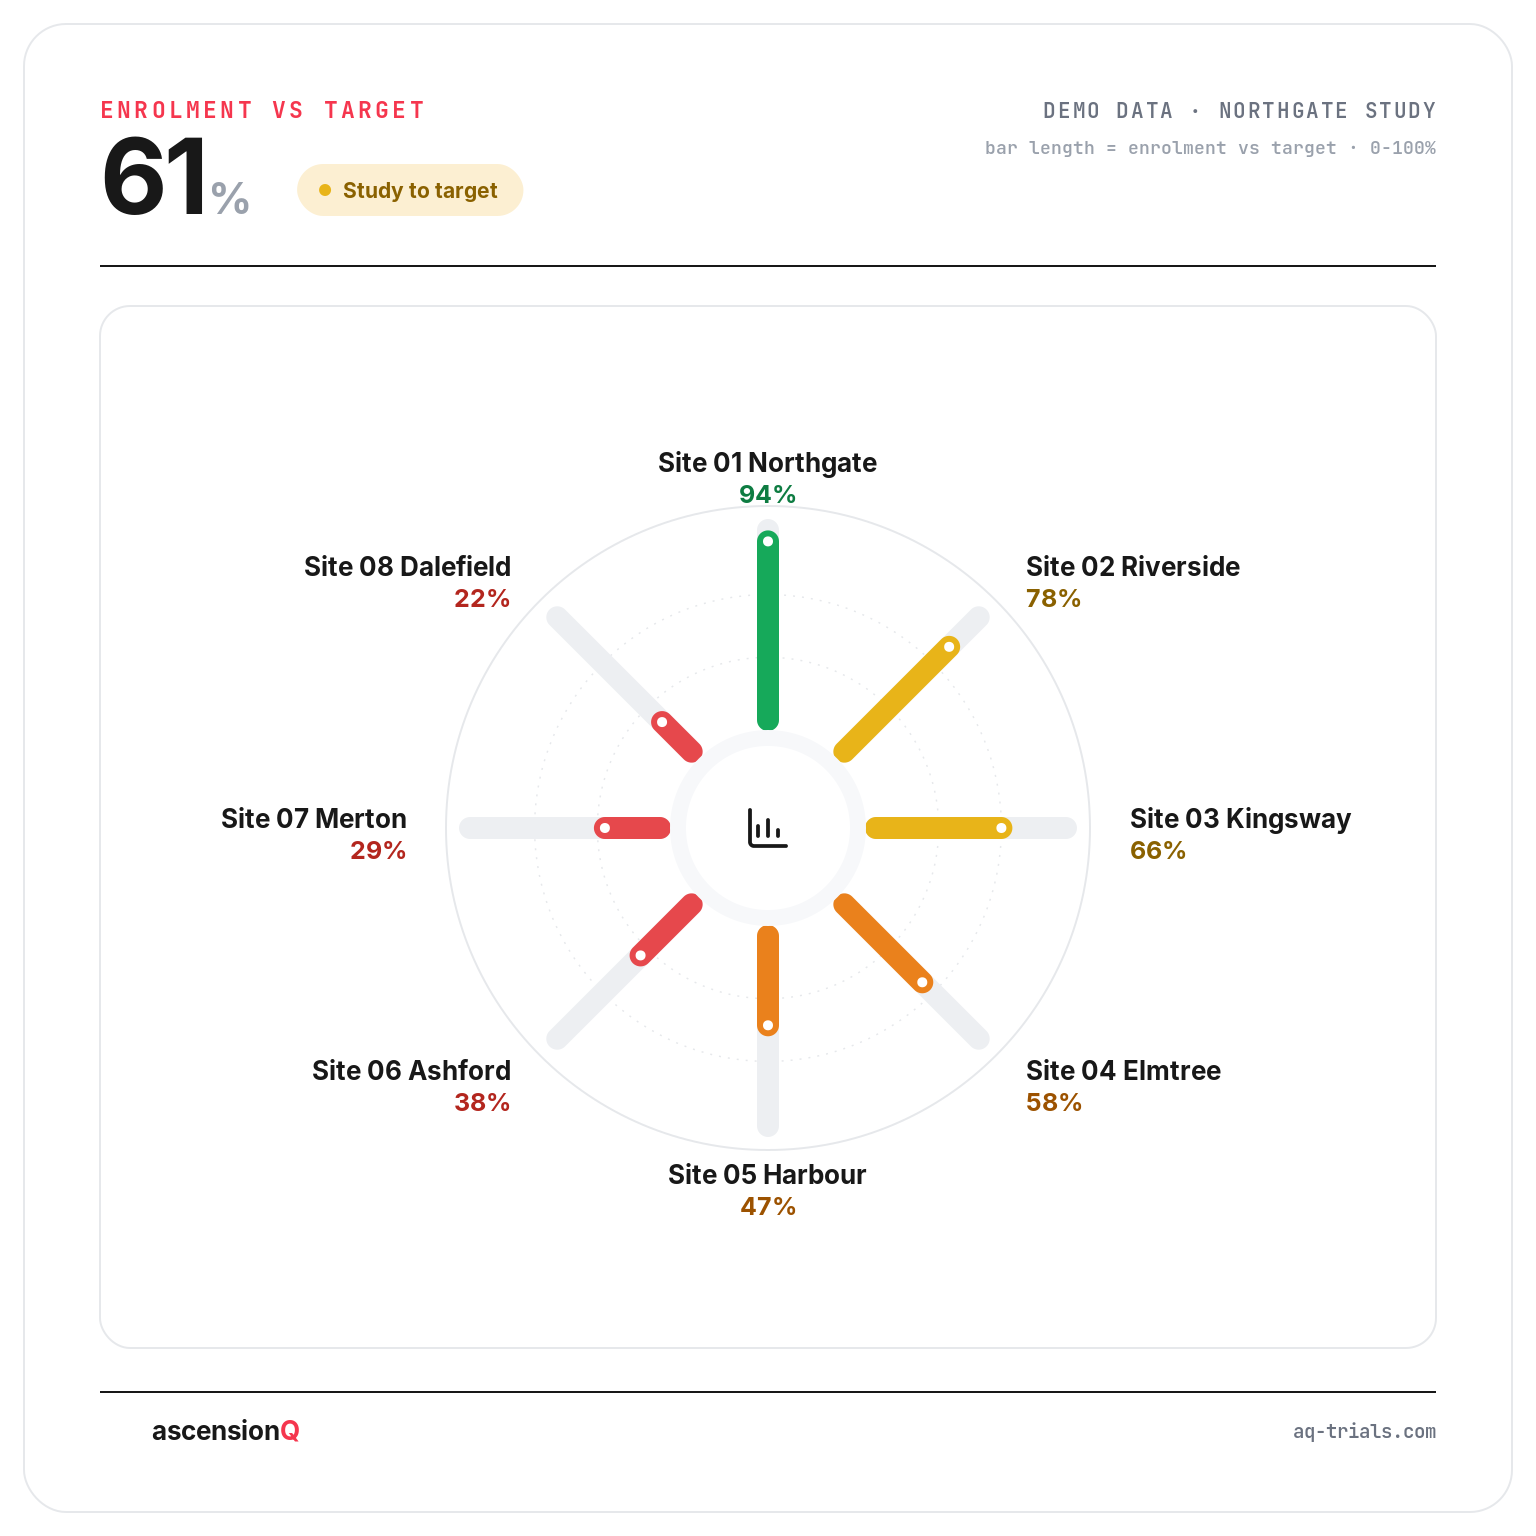
- Each site records against its own target. The system holds a per-site recruitment plan, so a site at 22% of its target reads as a red flag even while the study total looks healthy.
- The rollup is automatic. Site figures aggregate to a study total without anyone merging spreadsheets, which removes both the delay and the transcription error.
- Slippage triggers an alert. The system compares actual pace to planned pace and surfaces the sites falling behind, so oversight becomes proactive rather than retrospective.
- The data segregates cleanly for CROs. A CRO running multiple sponsors sees each study in isolation while still holding one operational picture across its portfolio.
The chart below shows a single study’s enrolment against target across eight sites. The study total sits at 61% of plan, which on its own looks like a manageable shortfall. The per-site view tells a different story. One site is close to target while three sit below 40%, and those three are where the coordinating team should spend its attention.
This visibility is central to multi-site oversight of the kind a Clinical Research Delivery Centre coordinates across a network, and to the sponsor oversight that ICH-GCP E6(R3) expects through proportionate, risk-based monitoring. Strong site selection sets the ceiling for this performance, which is why feasibility and site selection and live tracking work together.
Also Read: CTMS for CROs and multi-sponsor oversight
What Does a Recruitment Shortfall Look Like in Practice?
A worked example shows why the reason field matters more than the count. The scenario below is illustrative rather than a real study.
A study manager reviews an emailed spreadsheet and sees Site 07 has enrolled two participants against a target of nine. The total is alarming, but the spreadsheet offers no explanation. The manager schedules a call for the following week, and a further week passes before anyone understands the cause.
The same study on a live CTMS reads differently. The screening log shows Site 07 has screened fourteen participants and failed twelve, with a single coded reason attached to nine of them: an eligibility criterion on prior medication that the local population rarely meets. The constraint is the protocol against that site’s catchment, not the site’s effort.
- A weekly count says “two enrolled” and prompts a chase. The number looks like underperformance and invites the wrong conversation.
- A live tracker says “twelve screen fails, nine on one criterion” and prompts a protocol discussion. The reason points straight at the fix.
The count tells you a site is behind. The reason tells you what to do about it.
What Are the Risks of Poor Recruitment Visibility?
Late recruitment information carries operational and regulatory cost. The risks compound the longer a shortfall stays hidden.
- Timeline overrun. A study that spots a shortfall in month six has fewer options than one that spots it in month two.
- Wasted site activation. A site that recruits nobody still consumes set-up cost and green-light effort, and poor visibility lets it stay open too long.
- Weak sponsor oversight. A sponsor that cannot evidence how it monitors recruitment falls short of the oversight expected under UK clinical trials regulation and good clinical practice.
- Poor decisions on rescue sites. A team that adds sites without accurate per-site data may reinforce the wrong part of the network.
- Data integrity questions. Recruitment figures rebuilt from memory or reconciled across versions invite challenge at audit.
These are the operational risks that connected systems exist to reduce, particularly for NHS hospital research teams running several studies across departments at once.
Frequently Asked Questions
What does clinical trial recruitment tracking software do?
It records how many participants each site has referred, screened, consented and randomised, and shows those numbers against target in real time.
Why do weekly recruitment updates fail sites?
The figures are counted by hand from a screening log, typed into a spreadsheet and emailed on, so a shortfall is visible only days after it starts.
Why does the reason field matter more than the count?
A count shows that recruitment is behind. The recorded reason for each screen failure or withdrawal shows why, which is what a team needs to fix it.
How AQ’s CTMS Supports Recruitment Visibility
AQ’s clinical trial management system tracks recruitment as part of a connected platform rather than a standalone tracker. Each site records referrals, screening, eligibility, consent and randomisation in one structured place. The system holds a per-site target, aggregates every site to a live study total, and flags sites that fall behind pace. Screen failures are captured as coded reasons, so the pattern behind a shortfall is visible rather than buried in a total.
Recruitment data sits alongside the wider study record on the AQ platform, so the same system that shows enrolment also holds the delegation log, the site file and the visit schedule that recruitment depends on. The audit trail records every entry, which supports the evidence a sponsor needs at inspection.
What the system does not do is recruit participants. It does not design an outreach strategy, widen an eligible population, or replace the judgement of the research team about how to respond to a lagging site. AQ makes recruitment visible and current. The study team still owns the decisions that visibility informs. The value is that those decisions are made on live, per-site data rather than a figure that is already a week old.
To see real-time recruitment tracking in a connected CTMS, book a 30-minute product tour and we will walk through the screening funnel, per-site targets and slippage alerts with your own study structure in mind.