The UK Clinical Research Delivery (UKCRD) key performance indicators are a shared set of measures from the National Institute for Health and Care Research (NIHR) and the Medicines and Healthcare products Regulatory Agency (MHRA). They track how fast and how predictably a clinical trial moves from regulatory application through to first participant recruitment and on to delivery. The data to June 2026 tells one clear story. The regulatory front door is fast and consistent. Local study set-up is still the slowest and least predictable stage in the journey.
This guide breaks down all seven indicators with their exact figures, explains what each one measures and how each clock is defined, and reads the trend behind every headline number. It covers the separate trust-level report that names individual NHS organisations against the 90-day site target, and it traces how the underlying data is produced and why it publishes six months late. It then sets out my view on what the data means for sponsors, sites, and Clinical Research Delivery Centre hub teams, and where the practical work now sits.
Key takeaways
- Regulatory approval performs well. Combined review sat at 98% against a 99% target in April 2026, and the end-to-end 150-day set-up measure improved to a median of 122 days.
- Local set-up lags furthest. Only 55% of studies opened within 60 days of approval, and only 58% recruited a first participant within 30 days of opening, both against a 90% target.
- Delivery is strong once a study is open. Recruitment to time and target held at 82% in June 2026, above its 80% target.
- Trust-level performance splits sharply. Several trusts met the 90-day site target on every eligible study, while six trusts with three or more studies met it on none.
- The data carries a reporting lag and small monthly samples, so the honest read is the six-to-twelve-month trend.
What Are the UKCRD Key Performance Indicators?
The UKCRD KPIs measure the speed and predictability of regulatory approval and study set-up across UK clinical research. They combine data from the NIHR and the MHRA, and they draw primarily from the Central Portfolio Management System (CPMS), the NIHR database that tracks studies on the Research Delivery Network portfolio. The set sits alongside the wider reform programme introduced with the new UK clinical trials regulations, which brought combined review into statutory footing.
The release is explicit about its own limits. Coverage is not yet complete across all four UK nations, several CPMS fields are non-mandatory, and data for recent months is often incomplete because sponsors and sites enter information after the fact. The authors advise readers to focus on longer-term trends over six or twelve months rather than reacting to any single month. Those caveats matter for anyone quoting the numbers, and they shape how much weight each figure can carry.
The three study types
Studies fall into three types in the release, and the distinction runs through every indicator:
- Commercial contract studies are sponsored and fully funded by the life sciences industry.
- Commercial collaborative studies are industry-funded in whole or in part, with mixed sponsorship. This is a newer category, previously grouped with non-commercial work.
- Non-commercial studies are sponsored by universities, charities, or public funders such as the NIHR.
Non-commercial studies dominate the portfolio by volume. Commercial contract studies are fewer and often more complex, which is why they recruit fewer participants per study and attract the sharpest scrutiny on set-up speed.
The Seven Indicators at a Glance
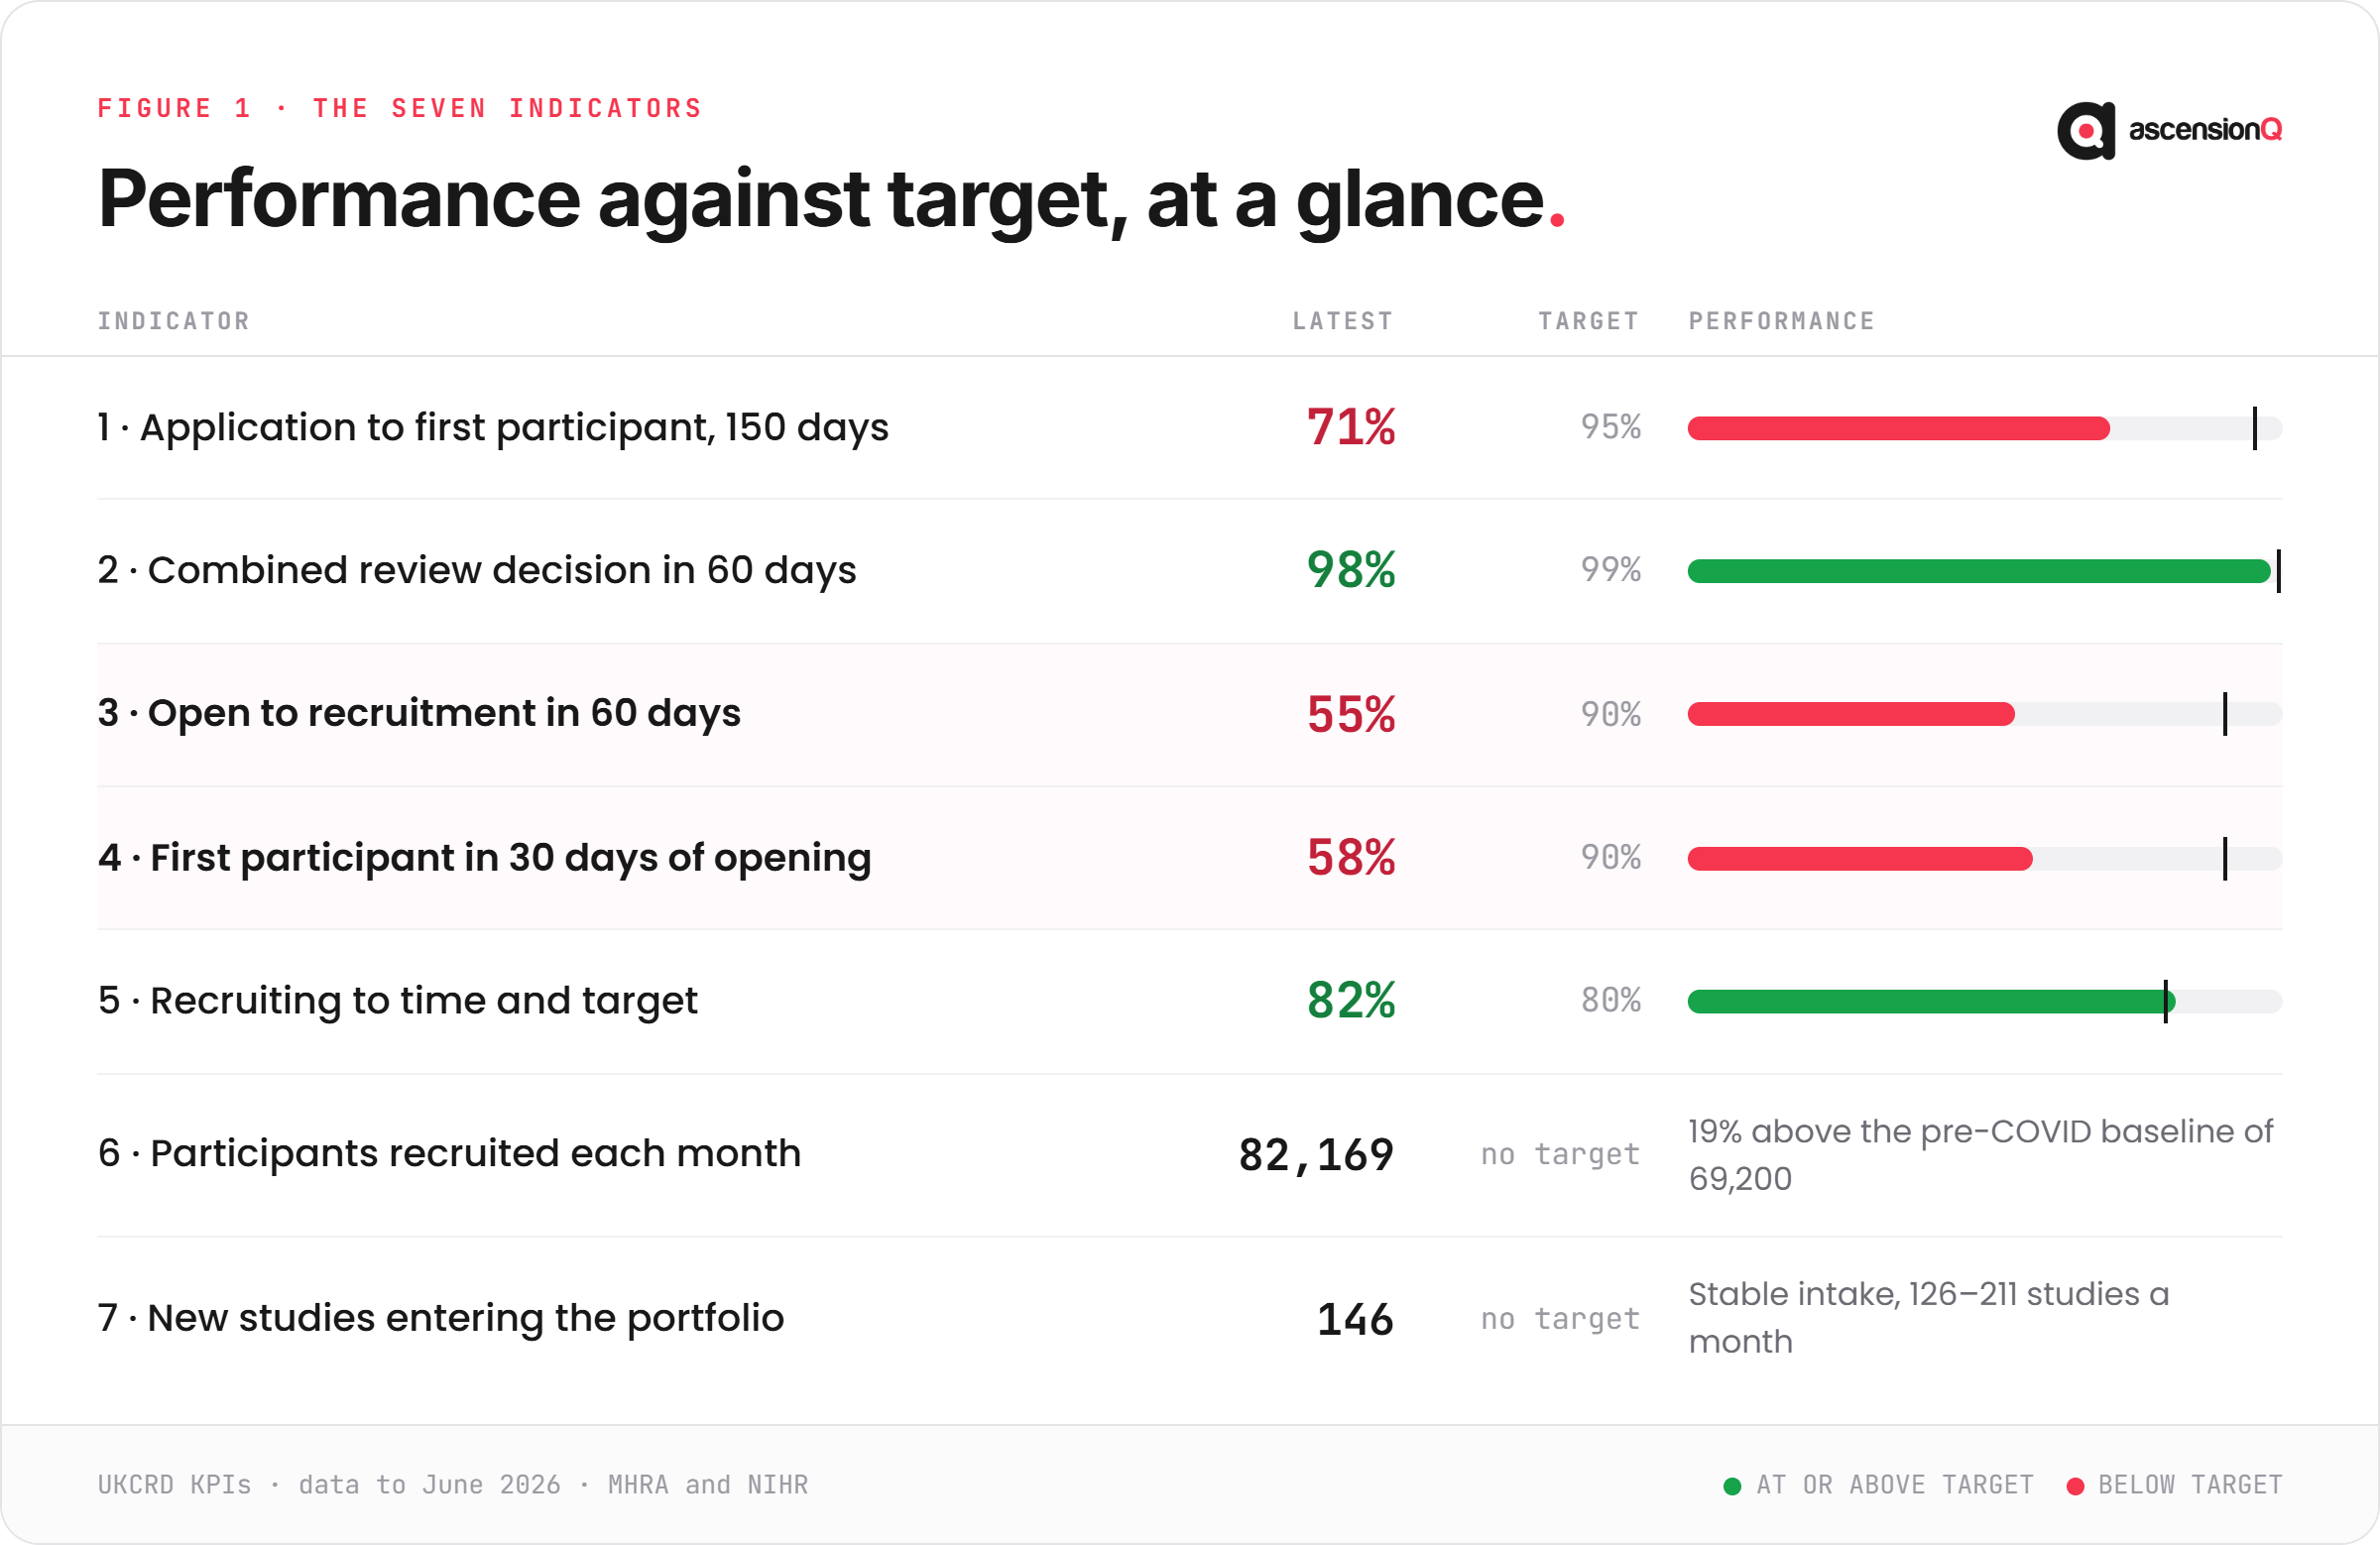
The table below sets each indicator against its target and its most recent figure. Data months differ by indicator because each measure carries its own reporting lag.
| Indicator | What it measures | Latest | Target | Month |
|---|---|---|---|---|
| 1 | Commercial contract CTIMP studies recruiting the first participant within 150 days of applying for regulatory approval | 71% | 95% | Dec 2025 |
| 2 | Studies receiving combined review approval within 60 days (90 for ATIMPs) | 98% | 99% | Apr 2026 |
| 3 | Studies opening to recruitment within 60 days of HRA approval | 55% | 90% | Dec 2025 |
| 4 | Studies recruiting the first participant within 30 days of opening | 58% | 90% | Dec 2025 |
| 5 | Open studies delivering recruitment to time and target | 82% | 80% | Jun 2026 |
| 6 | Average monthly recruitment volume | 82,169 | None | Apr 2026 |
| 7 | New studies added to the NIHR RDN portfolio | 146 | None | May 2026 |
The pattern is visible even at this level. The two measures sitting at or above target concern regulatory review and sustained recruitment. The two furthest below target, indicators 3 and 4, both concern the handover from approval into an open, recruiting site. The figure below sets each indicator’s latest result against its target, which makes the split plain.
How Fast Is Regulatory Approval?
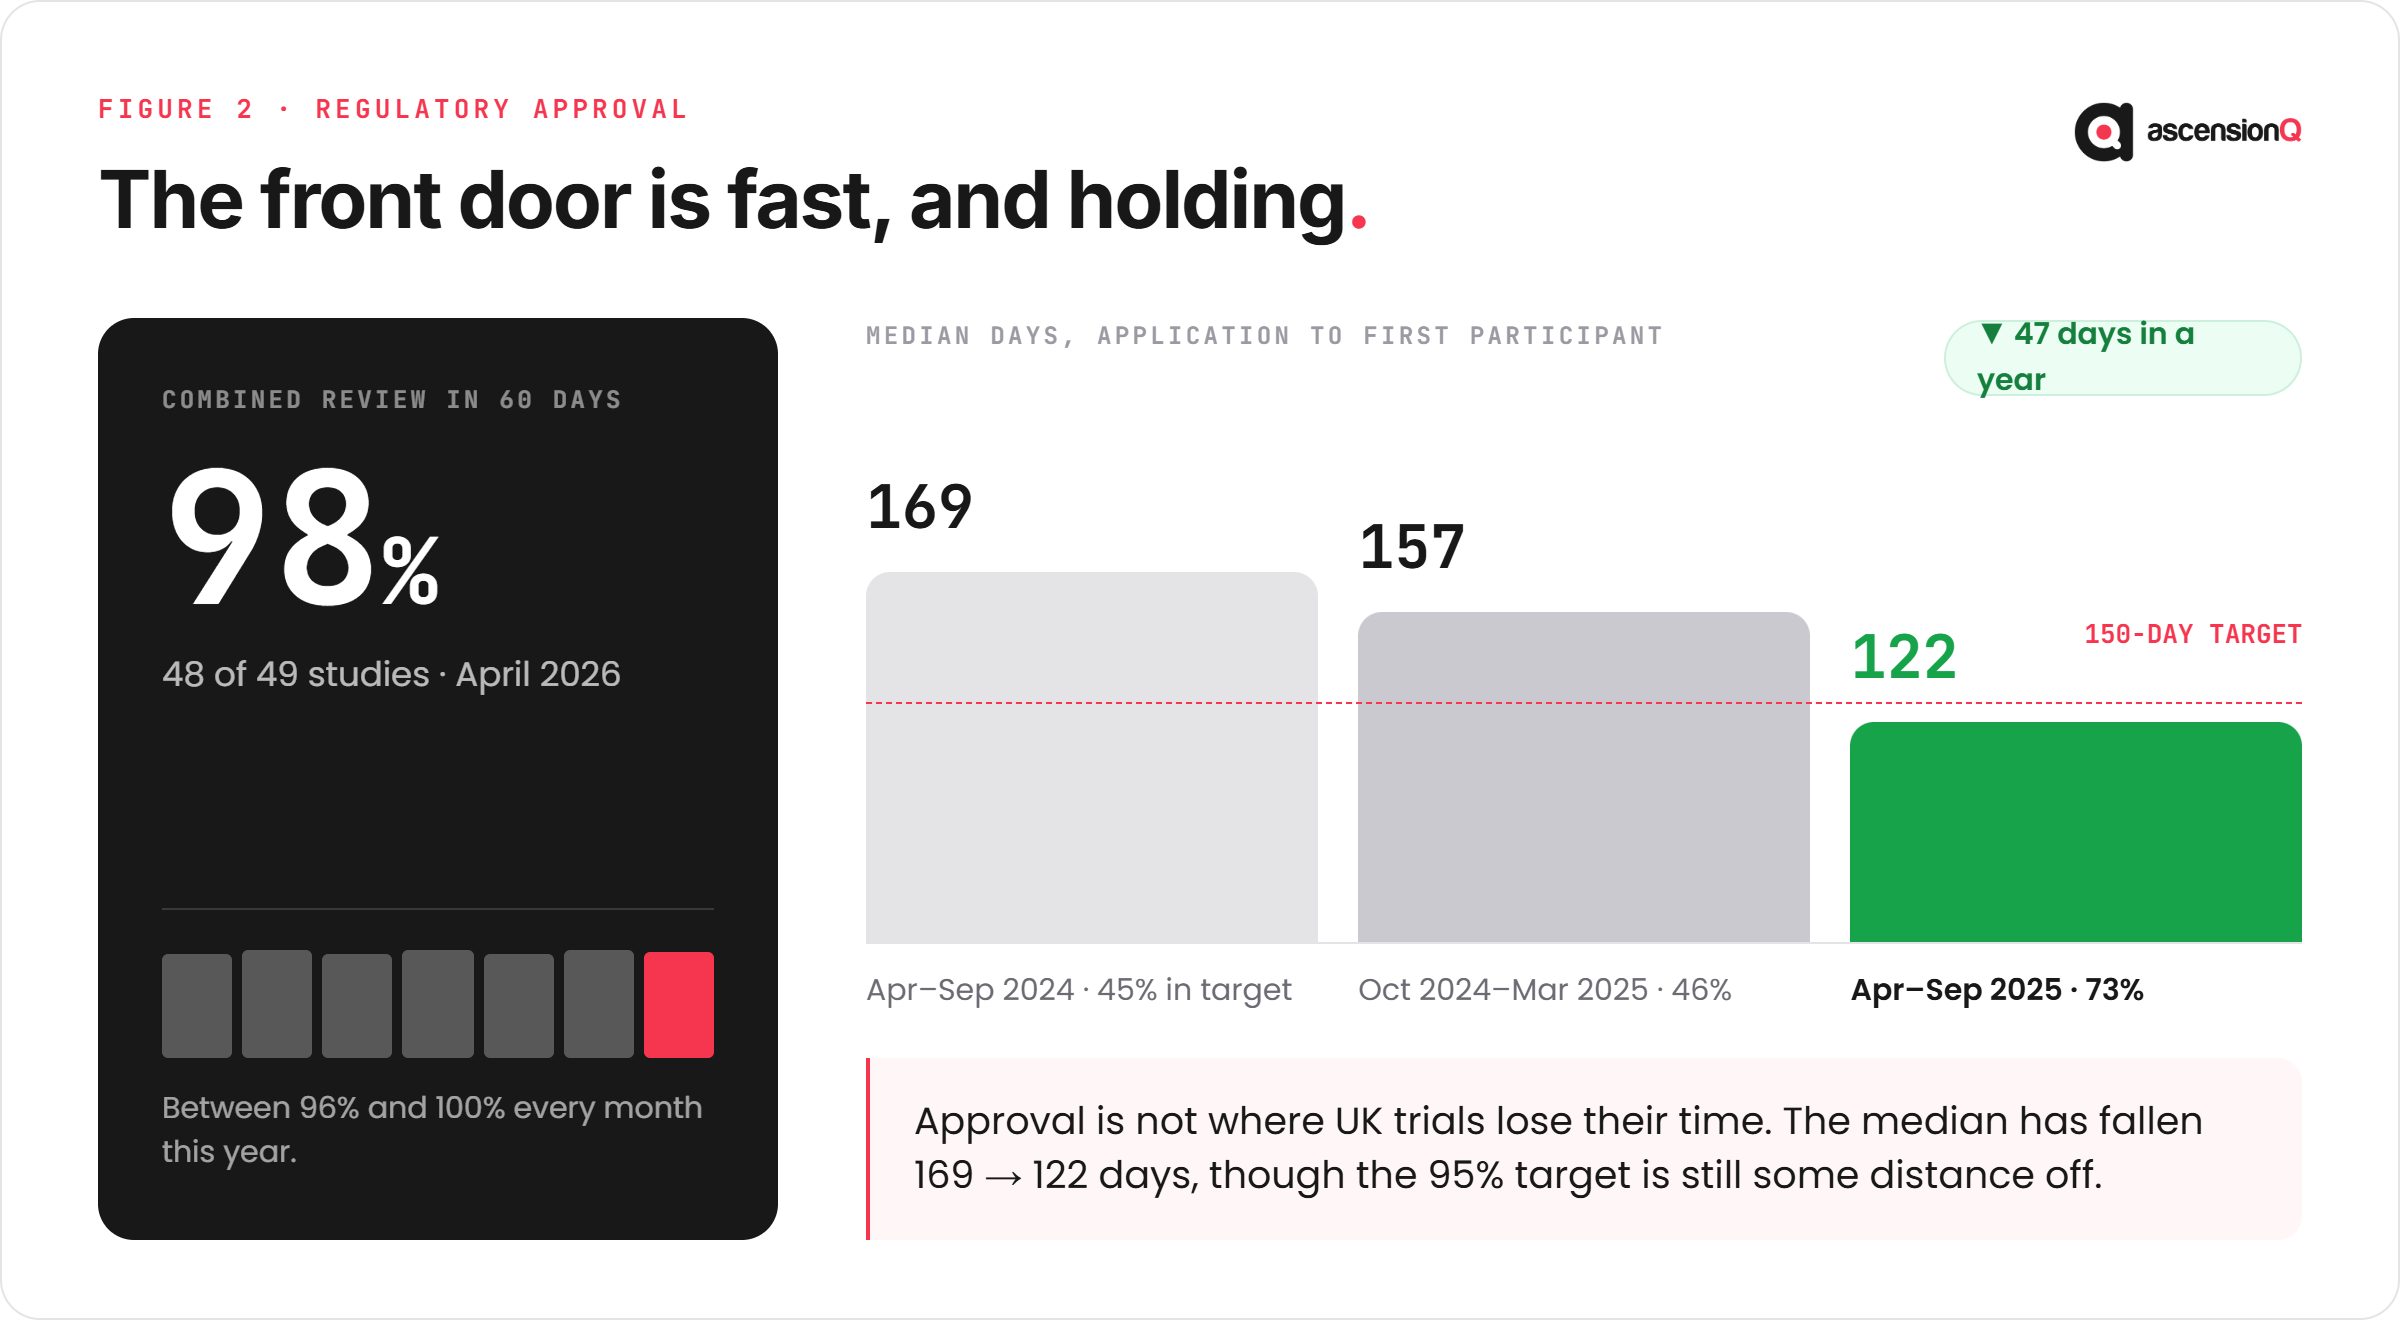
Indicator 2 is the strongest performer in the whole set. It measures the combined review process, where the MHRA and a research ethics committee assess a clinical trial application together. In April 2026, 98% of approved studies received a decision within the 60-day window, or 90 days for advanced therapy investigational medicinal products (ATIMPs). That figure represents 48 of 49 studies. Performance has held between 96% and 100% every month across the year, reaching 100% in September 2025, November 2025, and March 2026. The clock covers initial assessment plus the review of applicant responses, and it excludes the time applicants themselves take to answer requests for further information.
Indicator 1 is a newer, more ambitious measure introduced in April 2026. It tracks the full journey for commercial contract CTIMP studies, from application on the Integrated Research Application System (IRAS) to the first participant recruited, against a 150-day target aligned with the national ambition for commercial trial set-up. The December 2025 figure was 71%. The trend underneath is the encouraging part:
- April to September 2025: 73% within target, median 122 days
- October 2024 to March 2025: 46% within target, median 157 days
- April to September 2024: 45% within target, median 169 days
The median has fallen from 169 days to 122 days across roughly a year. The monthly figures rest on small study numbers, so they move sharply, and the 95% target is still some way off. The direction of travel is real all the same.
Approval is not where UK trials lose their time.
Also Read: The New UK Clinical Trials Regulations (2026): What Sites and Sponsors Must Do.
Where Does Set-Up Actually Slow Down?
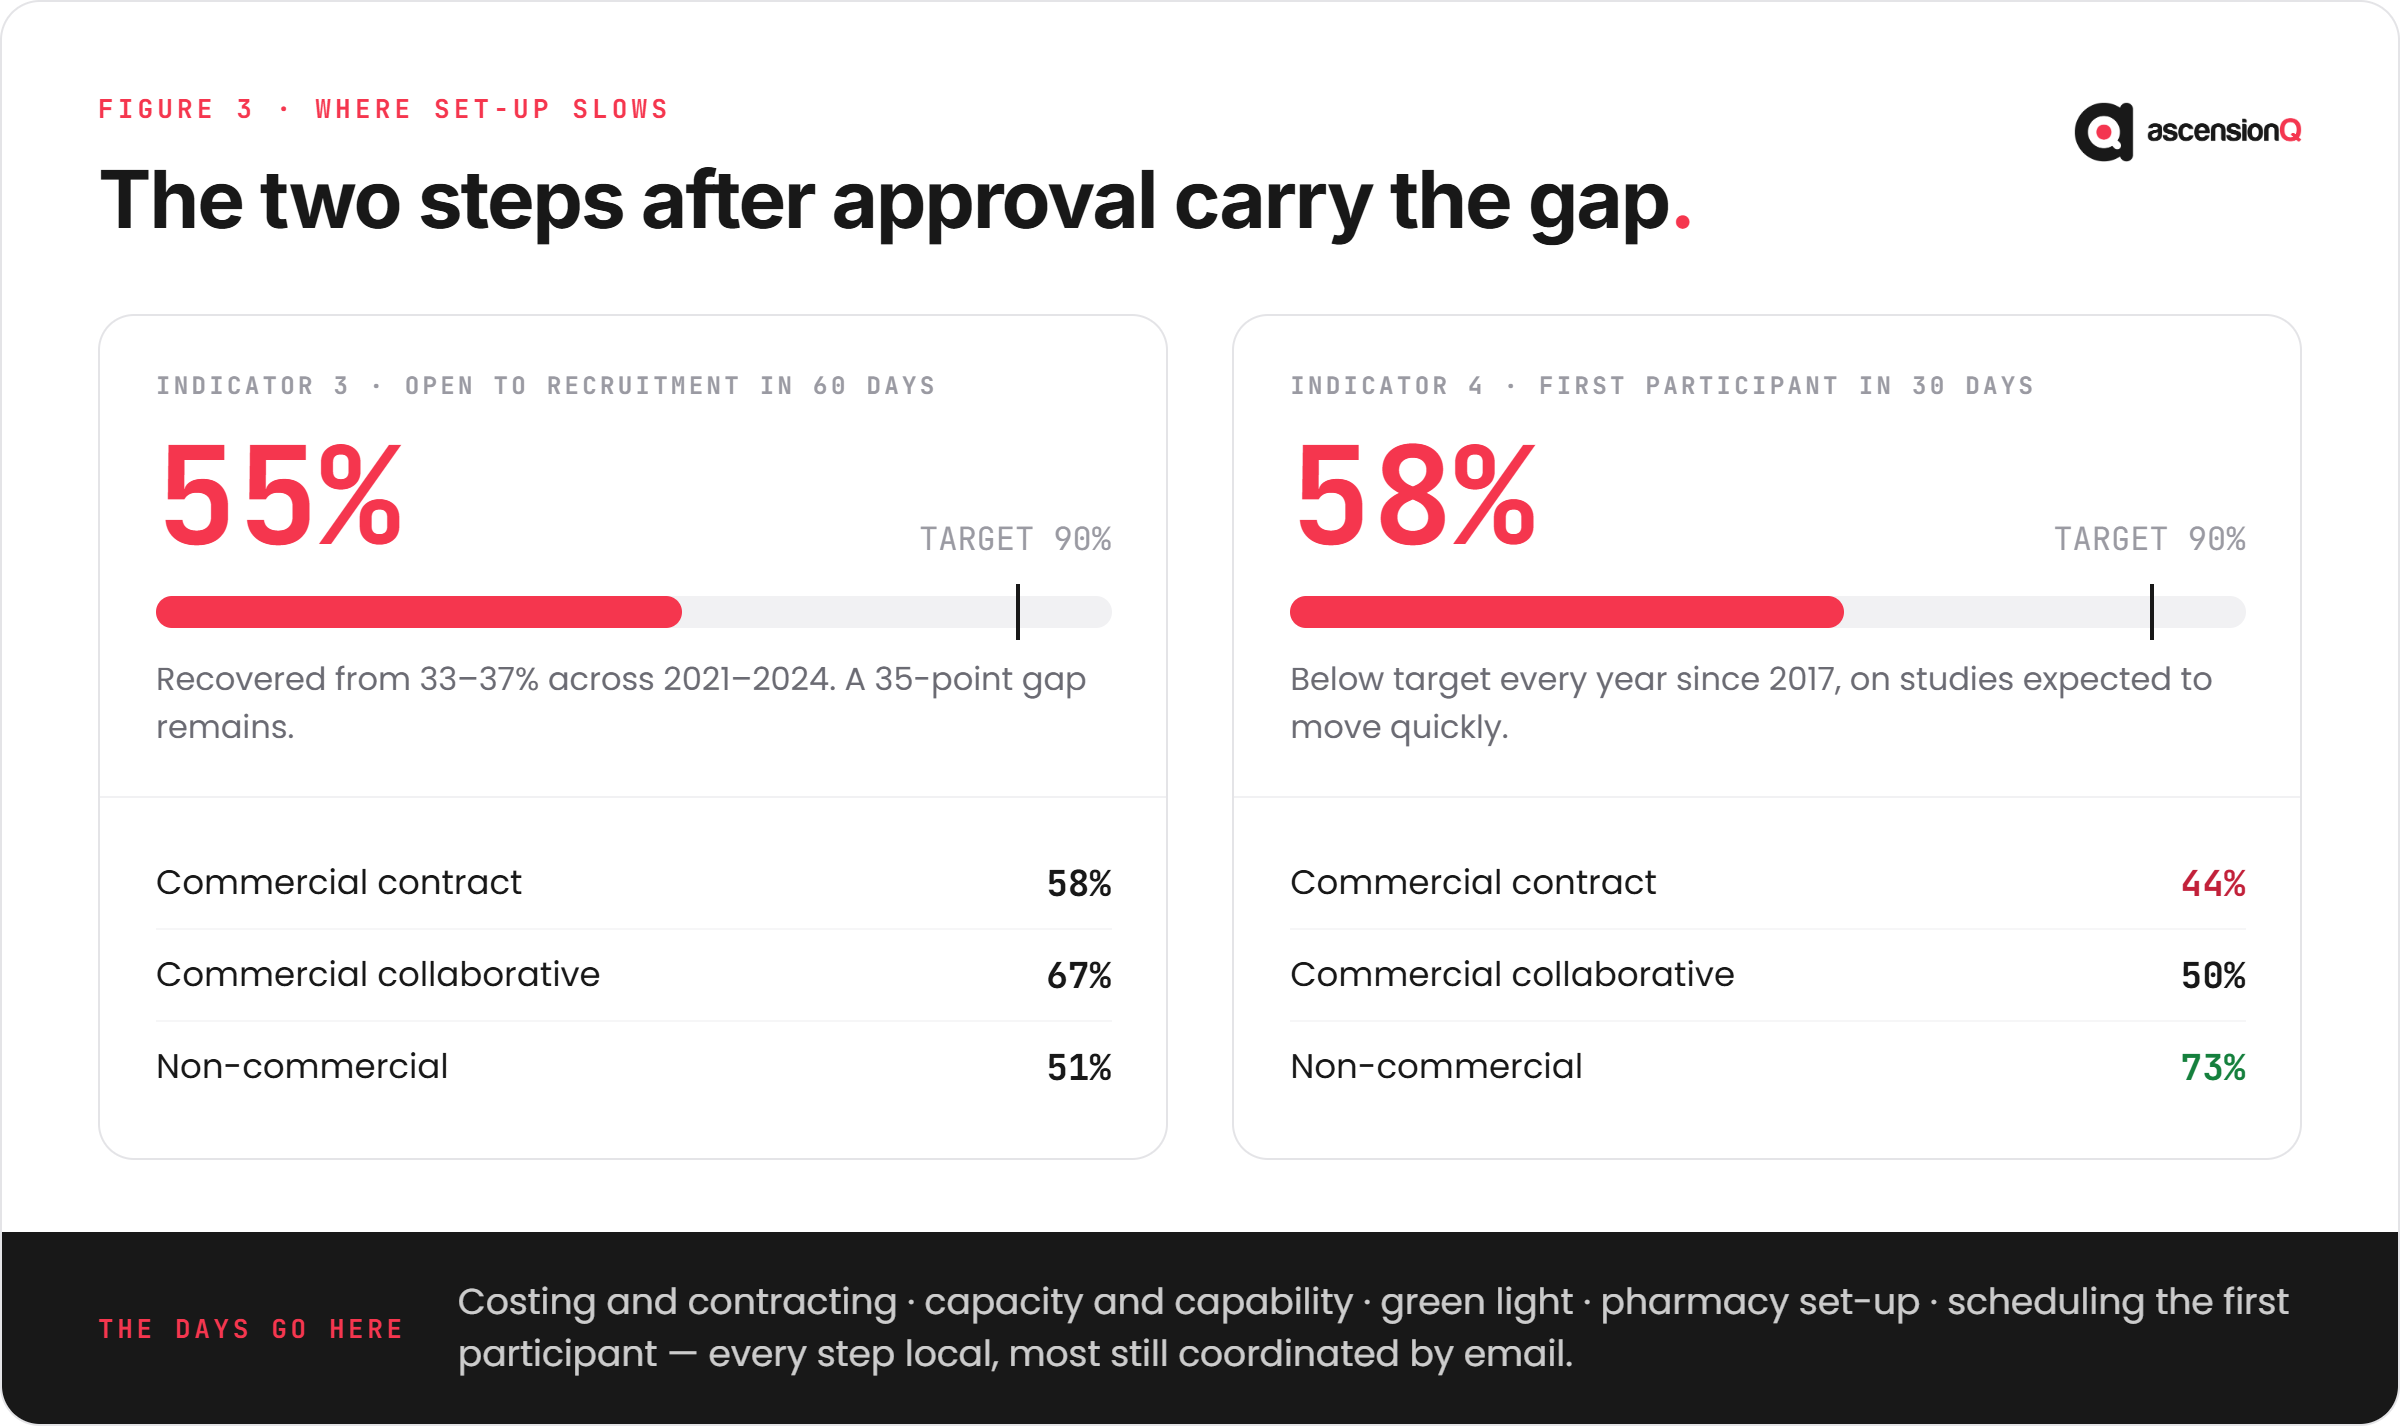
Indicators 3 and 4 measure the two steps after approval, and both sit far below target. This is the centre of the story. Indicator 3 covers the share of studies that open to recruitment within 60 days of Health Research Authority (HRA) approval. December 2025 sat at 55% overall against a 90% target, and the study-type split ran as follows:
- Commercial contract: 58% (25 of 43 studies)
- Commercial collaborative: 67% (4 of 6 studies)
- Non-commercial: 51% (30 of 59 studies)
Context matters on this one more than most. The measure held around 50% to 53% before the pandemic, fell to 30% in 2020 as the system reprioritised toward COVID-19 research, then settled at 33% to 37% through 2021 to 2024. Recovery to 43% followed across 2025, reaching 55% by December. The improvement is genuine, though the gap to target is still large.
Indicator 4 covers the share of studies recruiting a first participant within 30 days of opening. Here December 2025 came in at 58% overall against the same 90% target, and the study-type split inverts the commercial pattern seen above:
- Commercial contract: 44% (12 of 27 studies)
- Commercial collaborative: 50% (3 of 6 studies)
- Non-commercial: 73% (19 of 26 studies)
The history here is the blunt part. The share recruiting a first participant within 30 days has stayed below the 90% target every year since 2017, and average time to first recruitment has stayed above 30 days throughout. Rare disease and low-recruitment work, where a first participant is not expected inside 30 days, sits outside the measure, so these figures reflect the studies that were expected to move quickly. Much of the delay collects in site-level tasks such as costing and contracting, confirmation of capacity, pharmacy set-up, and completing the investigator site file essential documents.
Also Read: The Investigator Site File Essential Documents Checklist (ICH-GCP Chapter 8).
Which NHS Trusts Are Hitting the 90-Day Target?
A second publication answers that question by name. The UKCRD publishes a trust-level set-up report every month, listing individual NHS trusts in England against a 90-day target. The national indicators describe the system. This report describes a single organisation.
The report defines the measure as the 90-day site-level part of the 150-day target for commercial interventional trials. A site meets the target when it recruits its first participant within 90 days of either receiving regulatory approval or being selected as a site, whichever occurs later. The clock stops when that participant attends a first visit. The headline targets therefore describe one journey measured at three levels:
- The 150-day study-level target runs from the regulatory application through to a first participant recruited anywhere in the study.
- The 90-day site-level target covers the portion an individual trust controls, opening at approval or site selection, whichever falls later.
- Indicators 3 and 4 divide that same window again, into 60 days to open to recruitment and 30 days from opening to a first participant.
Performance between trusts is where the data turns uncomfortable. The strongest performers in the August 2026 report cleared the target on every eligible study:
| NHS trust | Studies | First participant within 90 days |
|---|---|---|
| University Hospital Southampton | 8 | 100% |
| Liverpool University Hospitals | 5 | 100% |
| London North West University Healthcare | 7 | 86% |
| University Hospitals Sussex | 6 | 83% |
| The Newcastle upon Tyne Hospitals | 21 | 81% |
The other end of the table carries the argument. Six trusts with three or more studies recorded 0%, meaning not one study reached a first participant inside 90 days. Median time to complete set-up ran from 5 days at the fastest reporting trust to 512 days at the slowest. Extension studies, rare disease studies and low-recruiting studies sit outside this measure, so the spread covers work that was expected to move at a normal pace.
Same protocols, same regulations, a hundredfold difference in days.
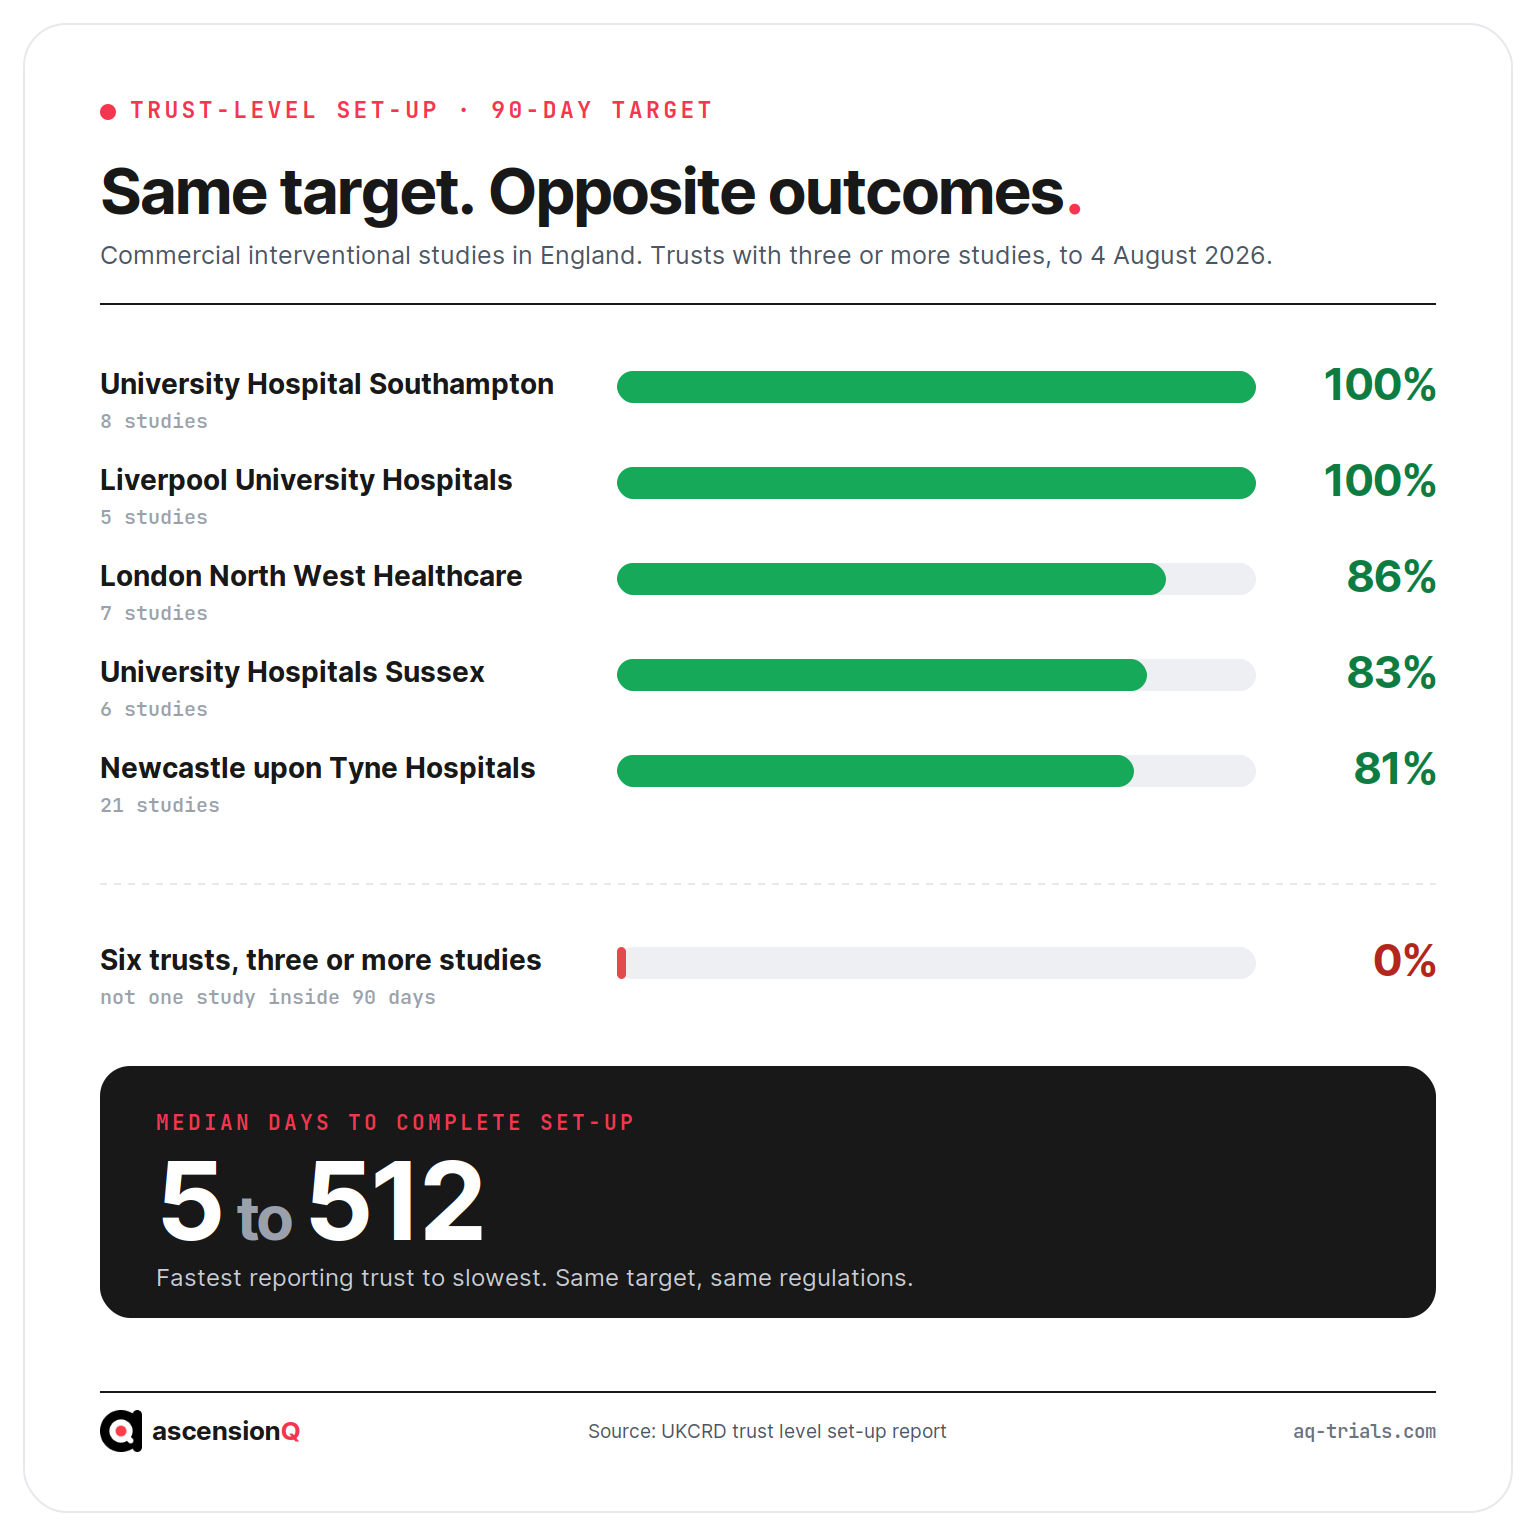
That range settles an argument. A target met on every study by one trust and on no study by another is a target the system can hit. The variable is local process, not national policy, and it is the reason set-up performance now sits squarely with NHS and hospital research teams rather than with the regulator. AQ has published its view on what closing that window takes in the 90-day readiness guidance for NHS research sites.
How Well Are Open Studies Delivering?
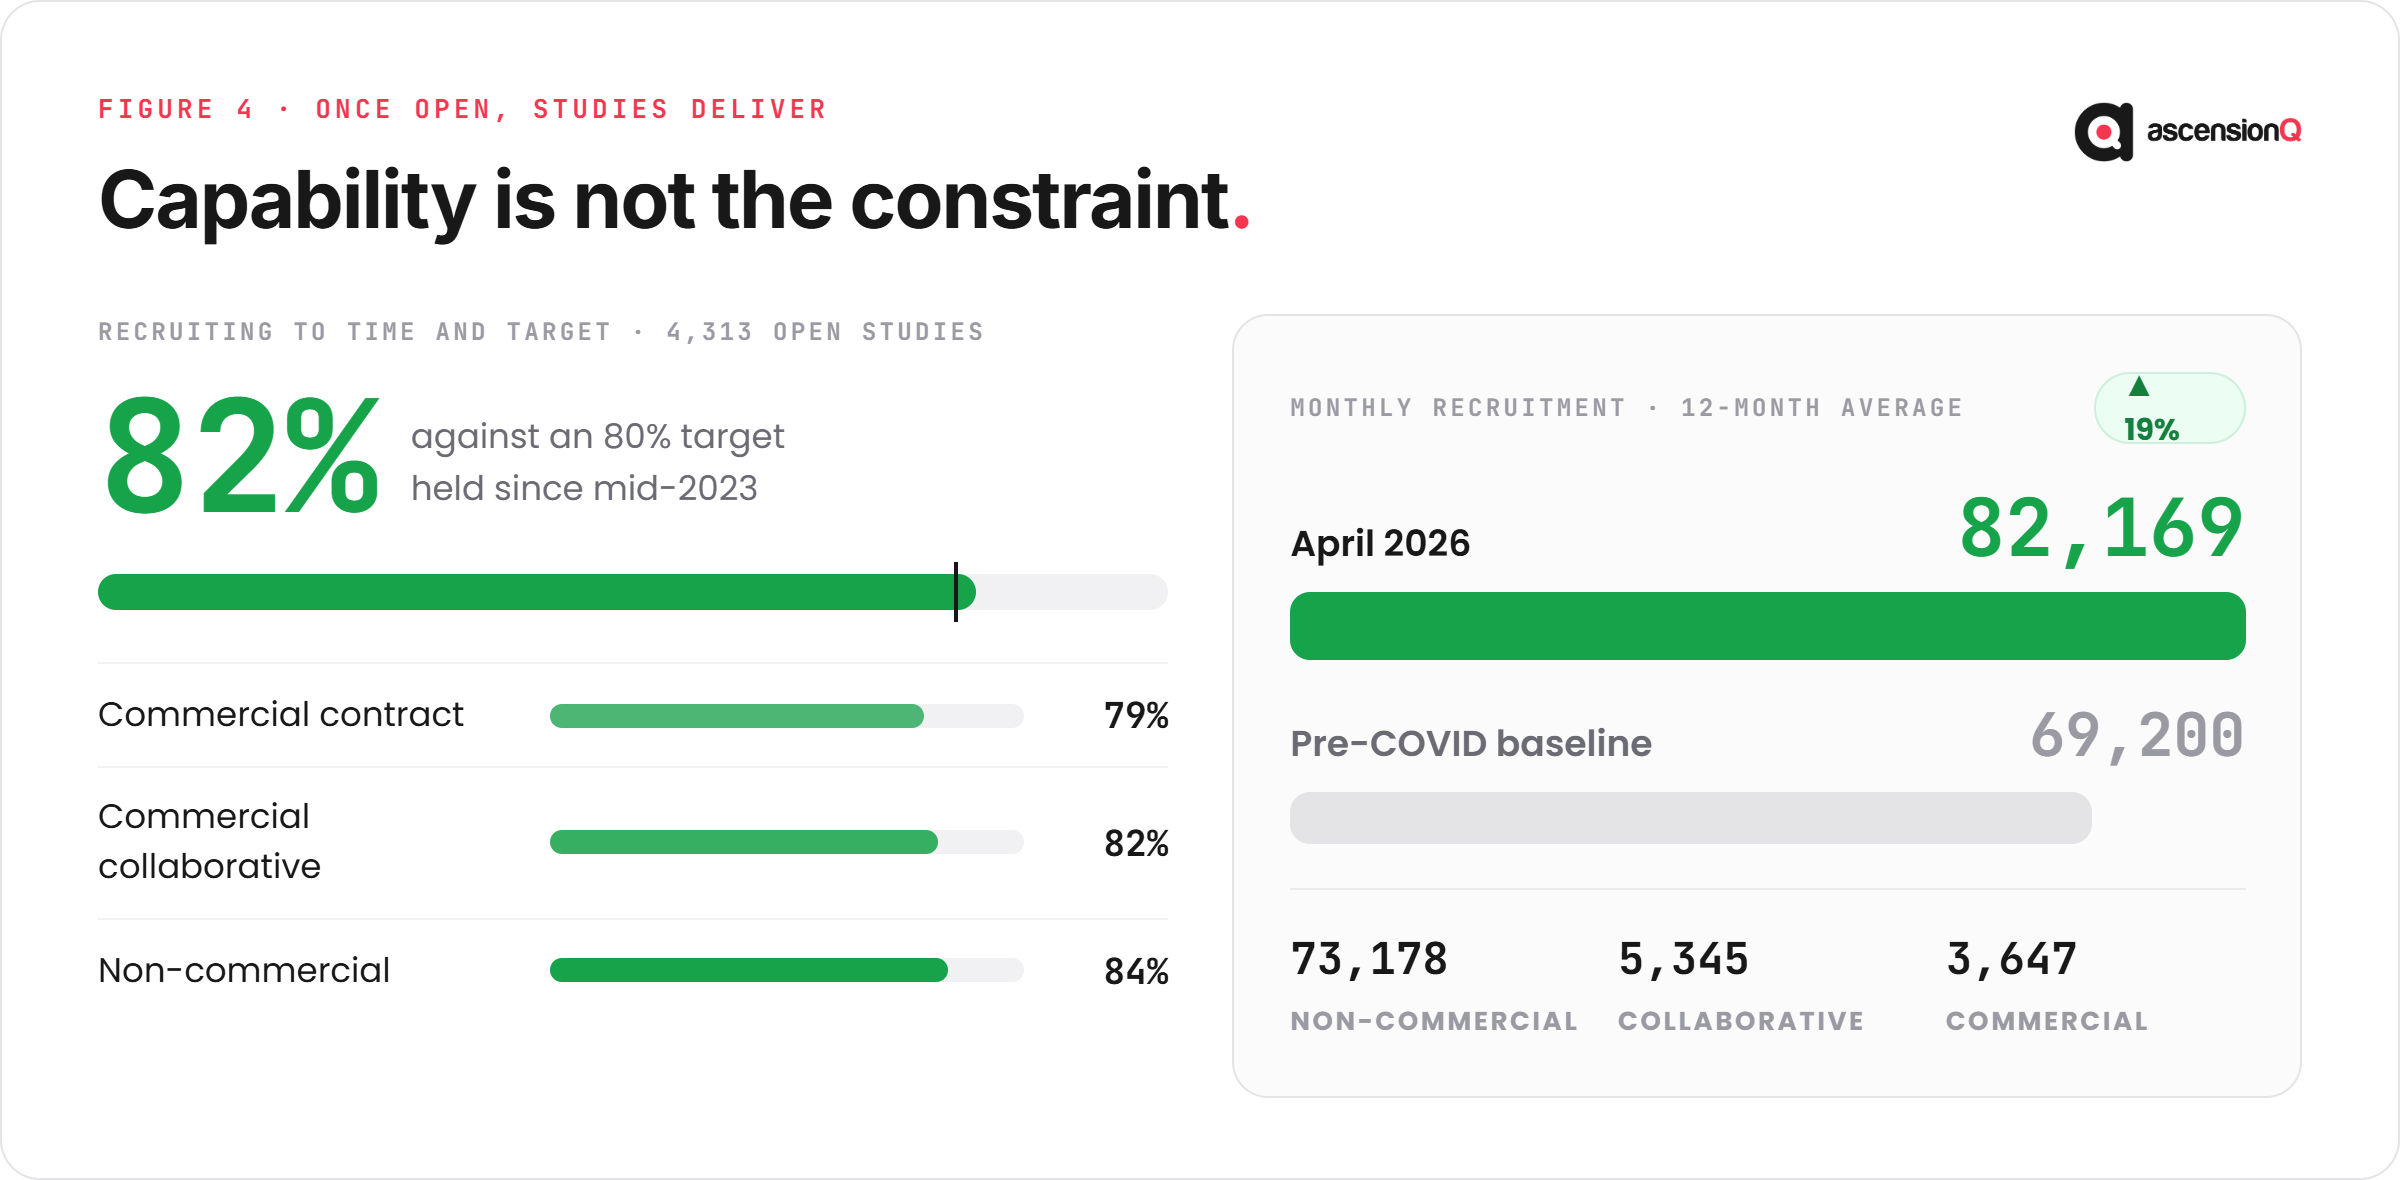
Performance improves markedly once a study is open and recruiting. Indicator 5 covers the share of open studies delivering recruitment to time and target. June 2026 reached 82% across 4,313 open studies, above the 80% target. Commercial contract sat at 79% (1,199 studies), commercial collaborative at 82% (347 studies), and non-commercial at 84% (2,767 studies). This is the one measure with a sustained record of clearing its bar, at or above 80% most months since July 2023 and within a tight 82% to 84% band across the past year. Live recruitment tracking is what lets a study team hold that pace across every site.
Indicator 6 reports total recruitment volume as a twelve-month rolling average. April 2026 stood at 82,169 participants a month, roughly 19% above the pre-COVID baseline of 69,200 (the January 2016 to December 2019 average). The composition has shifted since then:
- Commercial contract: 3,647 a month, against a 3,900 baseline
- Commercial collaborative: 5,345 a month, against a 7,500 baseline
- Non-commercial: 73,178 a month, against a 57,900 baseline
Non-commercial recruitment carries the total and now runs well above its baseline. The 2020 to 2021 pandemic surge, which pushed monthly recruitment past 150,000, has fully unwound, and volumes have settled into a higher-than-baseline steady state.
Indicator 7 counts new studies entering the portfolio. May 2026 saw 146 added: 59 commercial contract (40%), 13 commercial collaborative (9%), and 74 non-commercial (51%). Intake has stayed stable across years, with roughly one-third of new studies being commercial contract work over time. Monthly totals across 2025 and 2026 ranged from 126 to 211 studies, with a peak in July 2025.
Also Read: Recruitment Visibility: How a CTMS Tracks Enrolment in Real Time.
What Changed in the April 2026 Methodology?
The indicator set was revised in April 2026, so care is needed when comparing to older reports. Three changes matter most:
- Indicator 1, the 150-day end-to-end set-up measure, is new from April 2026 and has no long back-series.
- Indicators 3 and 4 had their scope changed in April 2026, so the current figures are not directly comparable with earlier definitions.
- Commercial collaborative studies are now reported as a distinct type, having previously been grouped with non-commercial work.
Two structural caveats sit under every figure. Reporting lag means most indicators publish six months behind the current date, so recent months fill in over time. Incomplete four-nation coverage means the data does not capture the entire clinical research system, and work with the devolved governments to improve completeness is ongoing. Both reinforce the report’s own guidance to read the trend, not the month.
How Is the Set-Up Data Actually Produced?
Every figure in both reports begins as a date entered by someone at a site. Sites record their set-up milestones in a Local Portfolio Management System (LPMS), those records flow into the CPMS, and the national reports read from CPMS. Individual sites do not calculate the 150-day measure themselves, because that calculation happens centrally. Four milestone dates carry most of the weight, and each one has a precise definition:
- Date Site Selected is the date set in the commercial site selected letter of intent, or the sponsor email confirming selection where that letter is not yet in use.
- Regulatory approval means HRA and HCRW Approval in England and Wales, and NRS Approval in Scotland.
- Date Site Confirmed replaced Date Site Ready to Start as the end point of the set-up window in January 2026. It records the last contract signature across every organisation involved, or the date of NHS management permission in Scotland.
- First Patient First Visit is the first date on which a potential participant signs an informed consent form.
The move to Date Site Confirmed shifted the finish line. A site that treated the sponsor green light as the end of set-up now carries the last contract signature instead, which brings several days of legal turnaround inside the measured window. The work packed into that window sits across several organisations at once:
- Costing and contracting runs through the National Contract Value Review (NCVR) for commercial studies, and the Schedule of Events Cost Attribution Tool (SoECAT) for non-commercial ones.
- Confirmation of capacity and capability is the trust’s formal decision that it can deliver the study as written.
- Study-wide technical assurances cover pharmacy and radiation, and they exist to remove duplicate local review at every participating site.
- Pharmacy set-up runs alongside the rest, and pharmacy documentation depends on materials arriving from the sponsor before a site can dispense.
Data entry then adds a delay of its own. Many CPMS fields are optional, sponsors and sites enter records after the event, and the published reports allow roughly six months for that to settle. The figure below traces the journey from an activity at a site to a number in a national table.
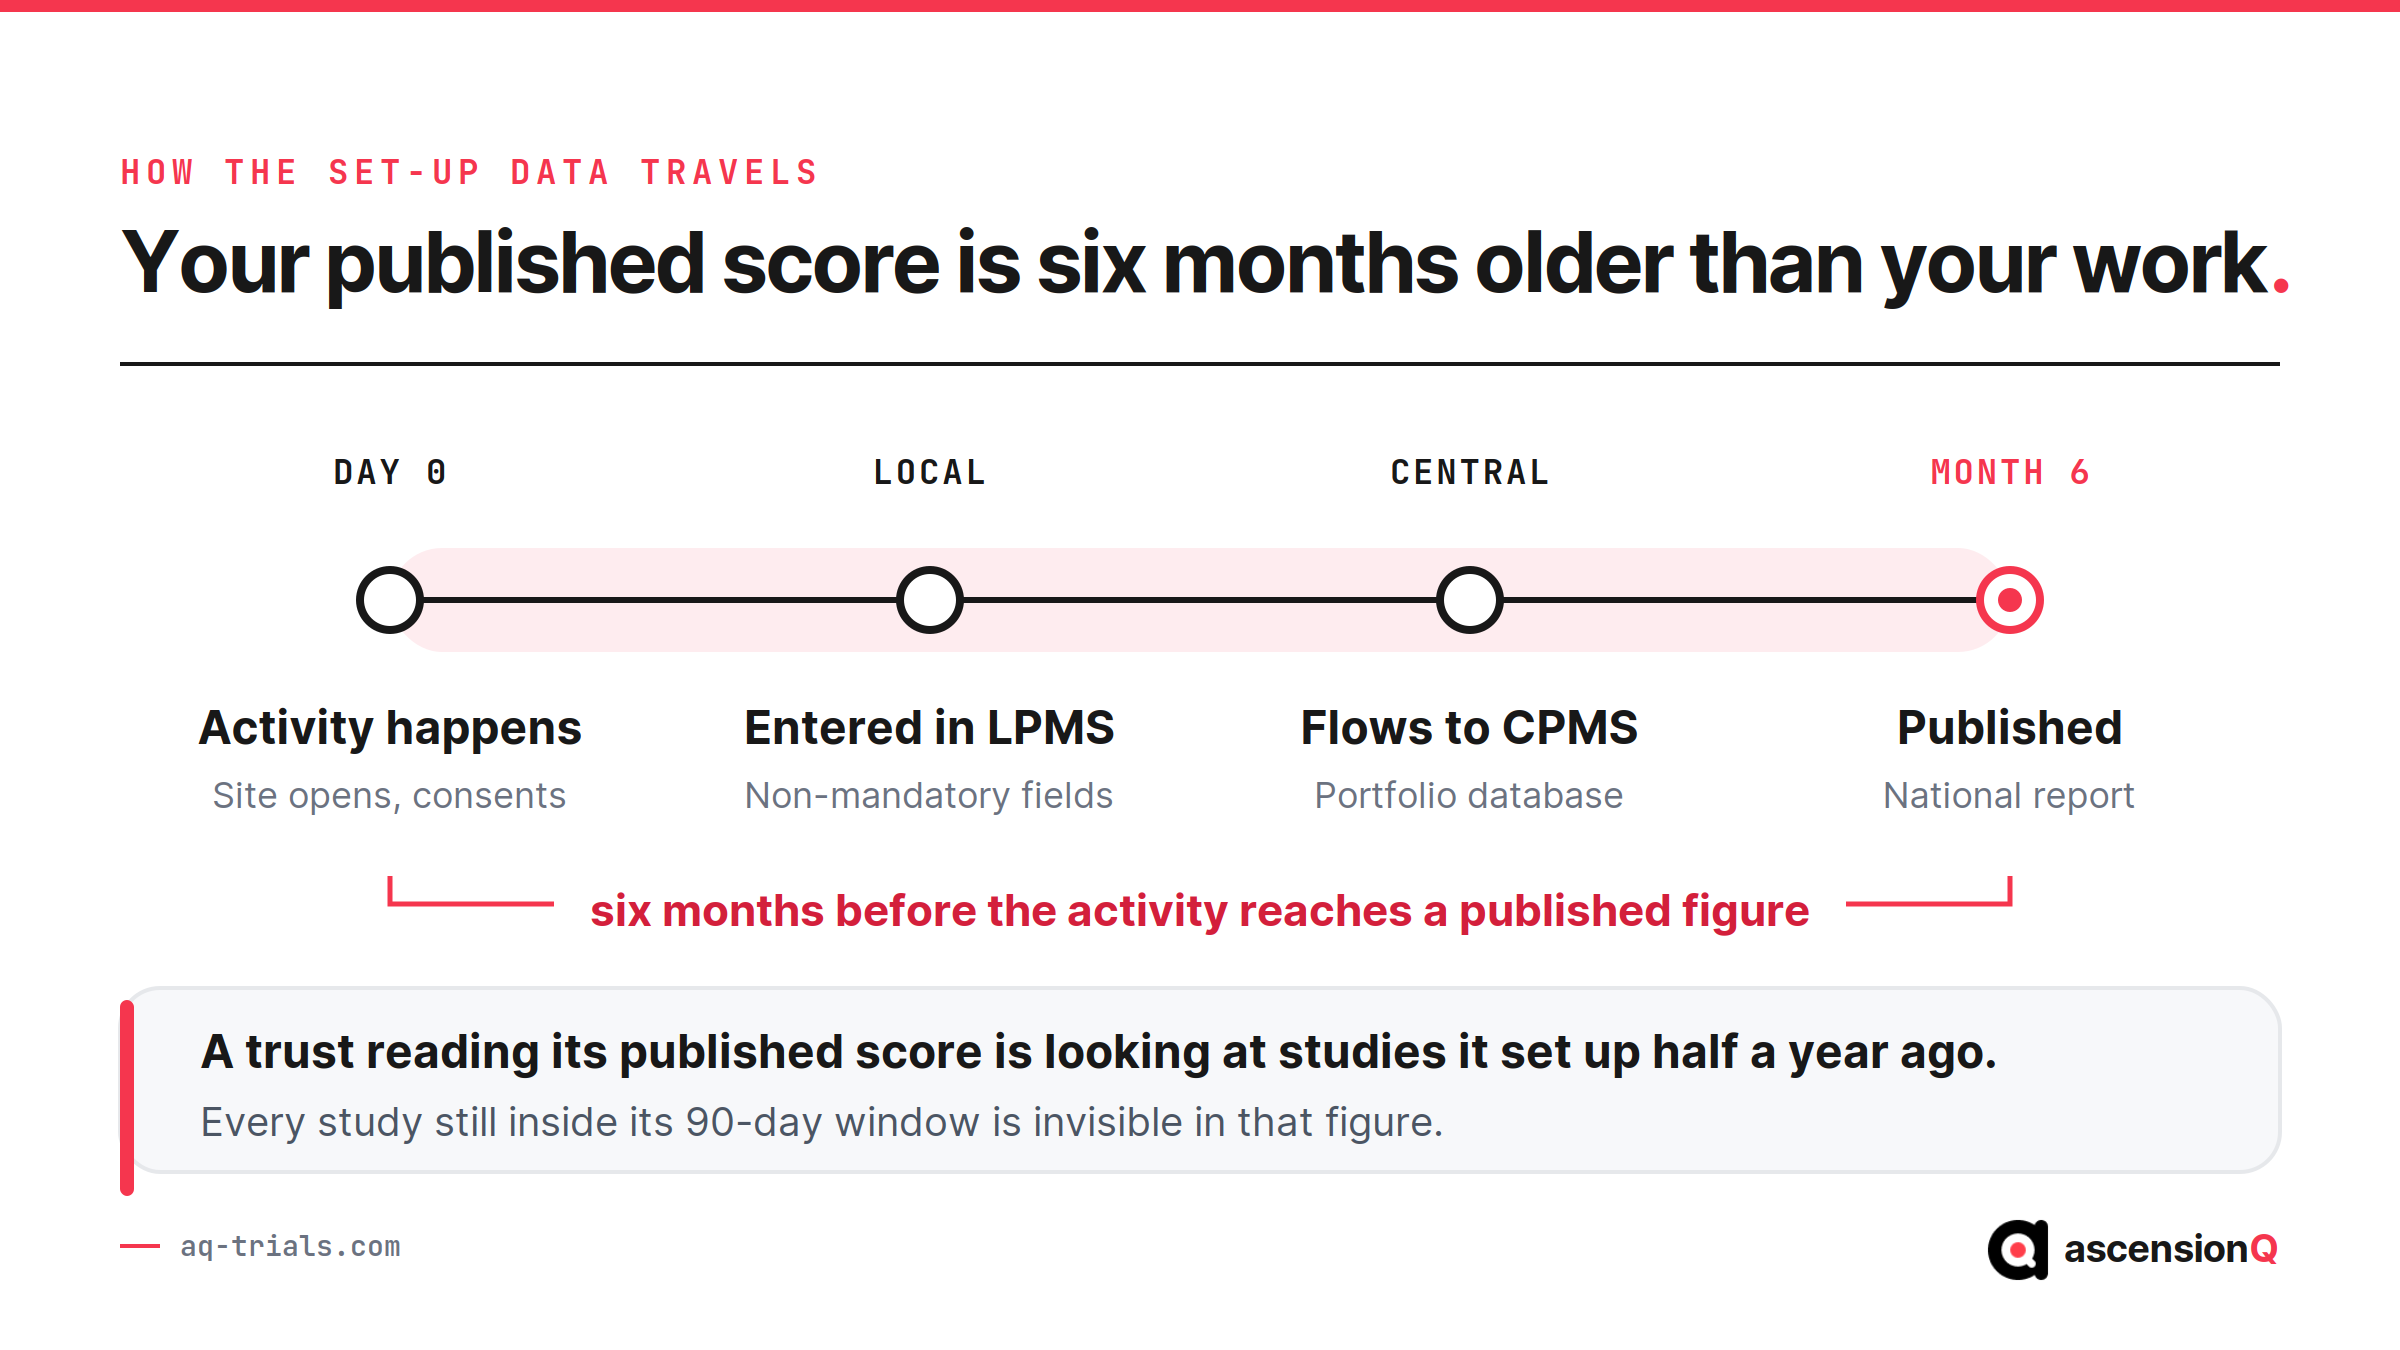
The lag matters most to the people being measured. A trust reading its own published score is looking at studies it set up half a year ago, and every study still inside its 90-day window is absent from that figure. Local instrumentation is the only way to see the current position while a team can still act on it.
The One Contrast the Data Draws
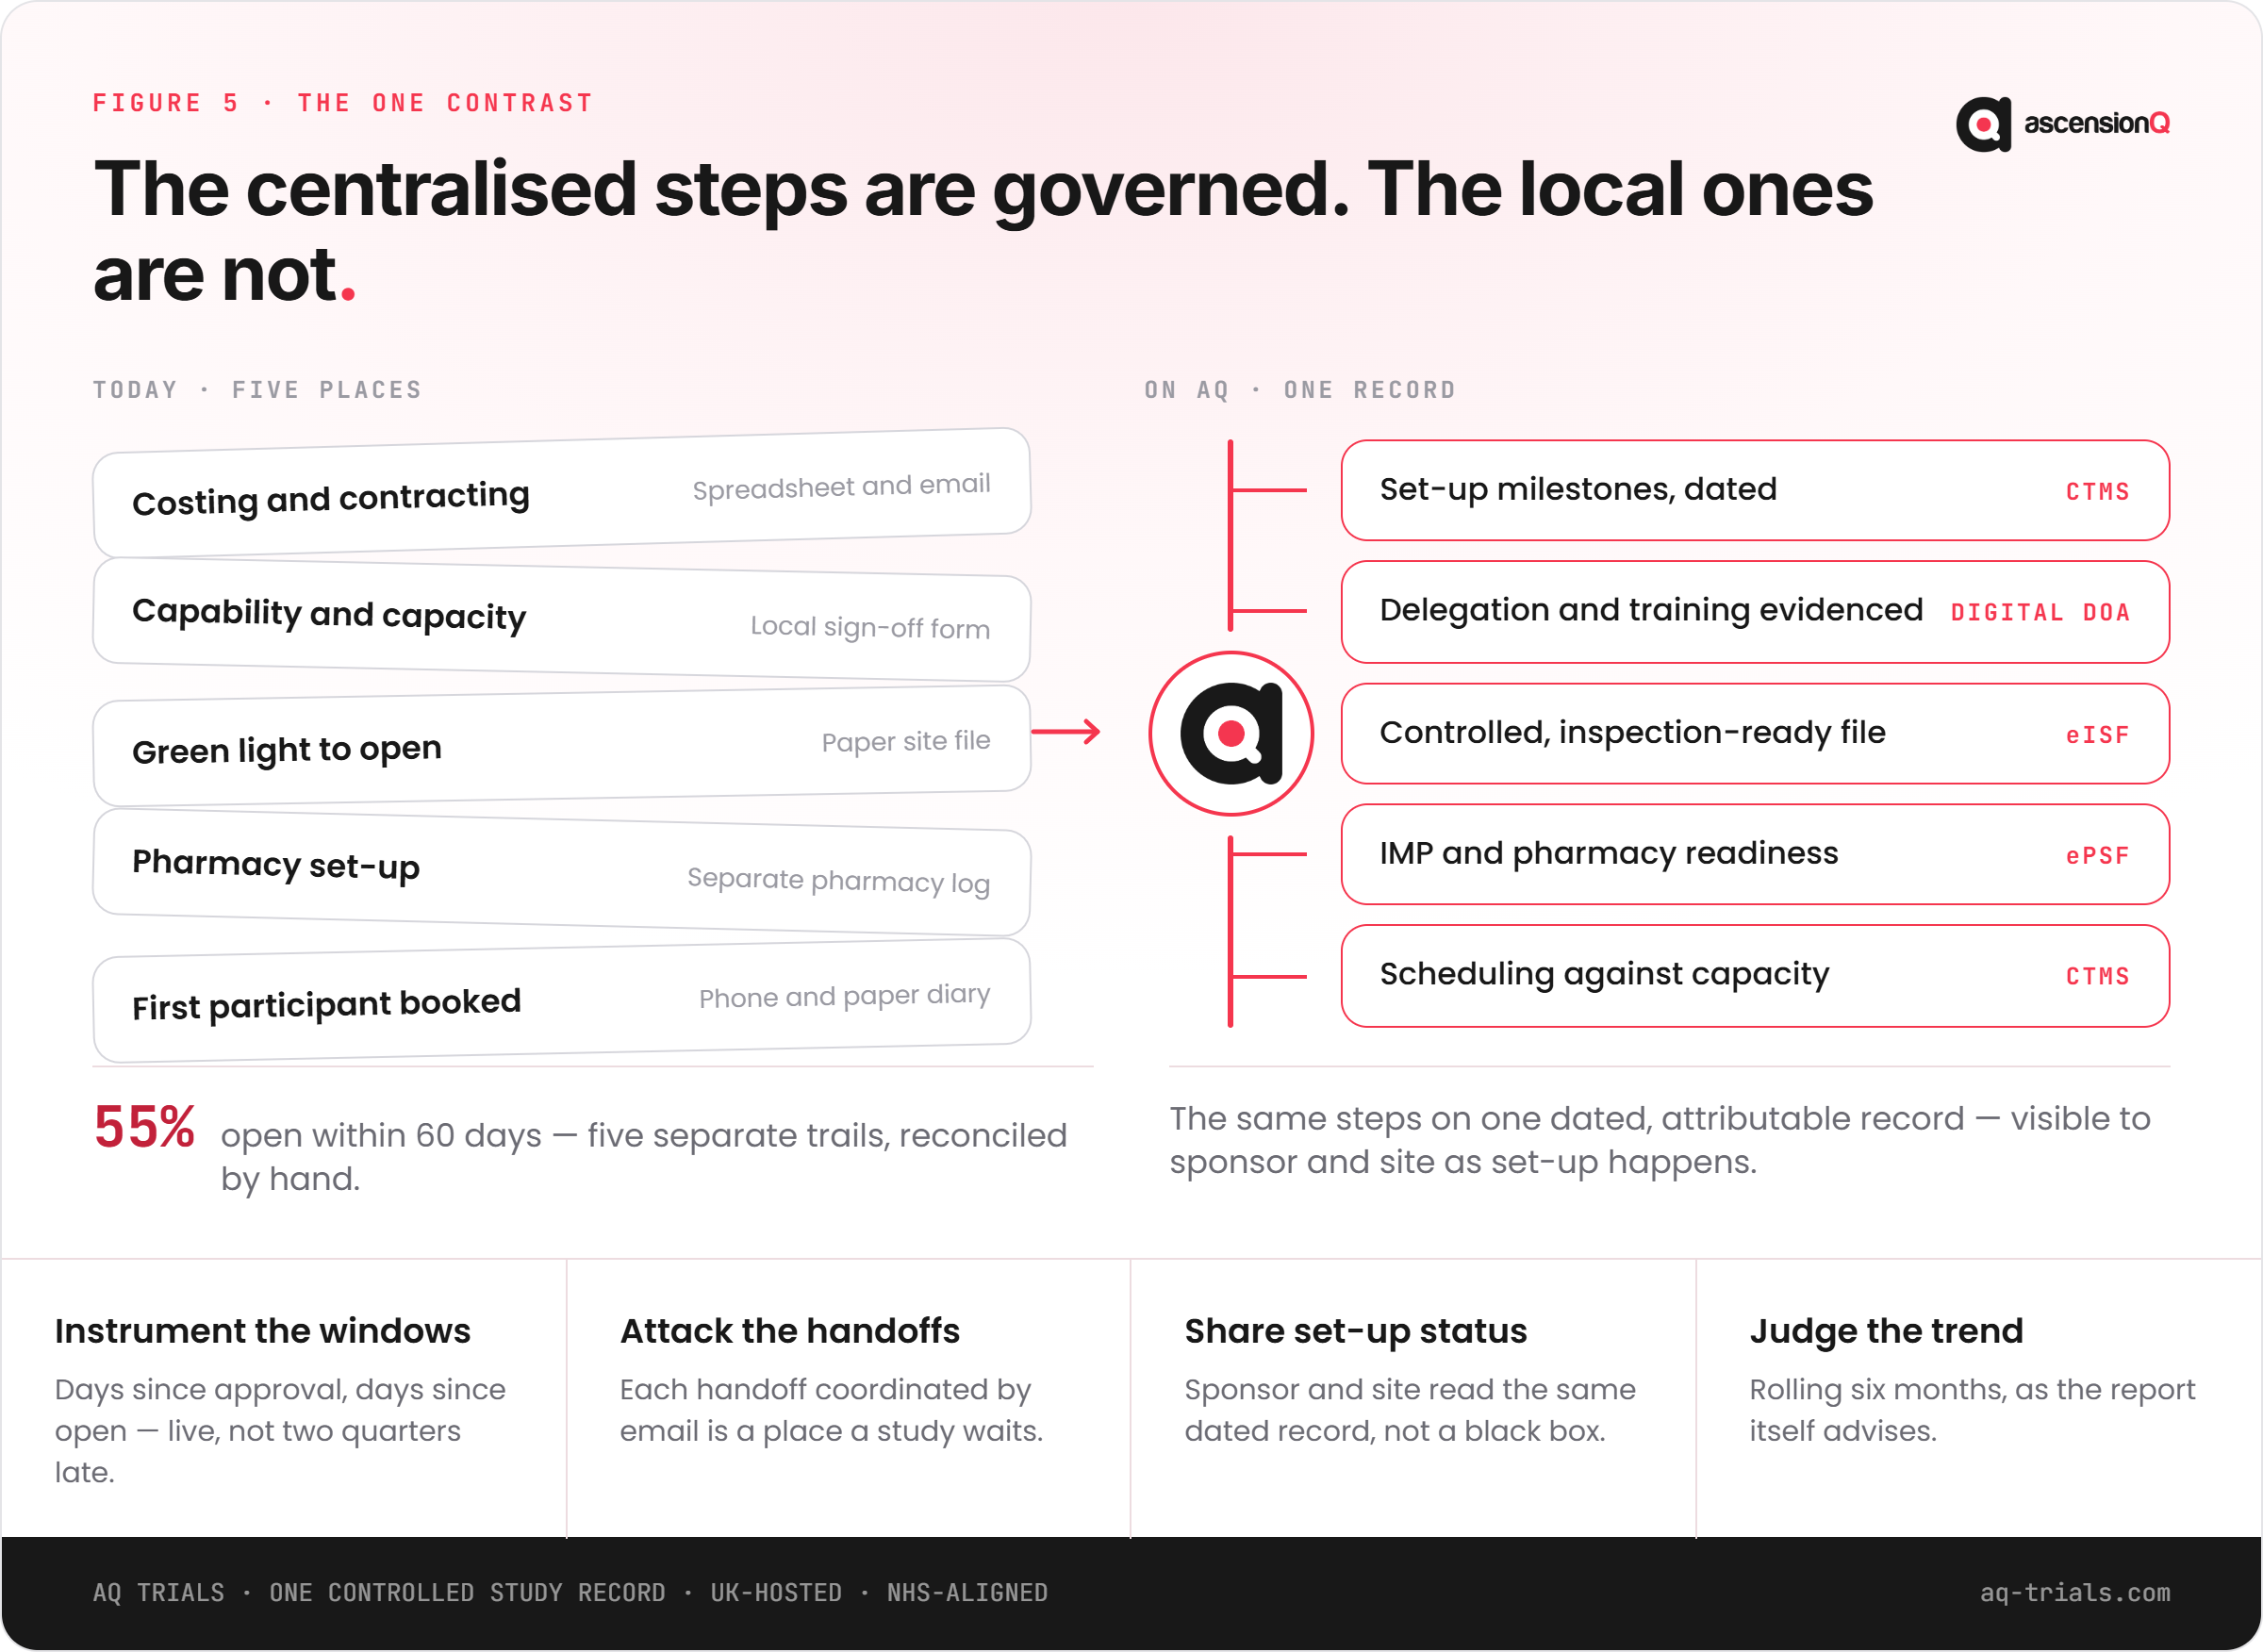
Read together, the seven indicators point at a single fault line. The regulated, centralised steps perform well. The local, distributed steps do not.
| Aspect | Regulatory approval (Indicators 1, 2) | Local study set-up (Indicators 3, 4) |
|---|---|---|
| Owner | MHRA and research ethics committees | Individual sites and R&D offices |
| Latest performance | 98% combined review; 150-day median down to 122 days | 55% open within 60 days; 58% first recruit within 30 days |
| Direction | At or near target, improving | Recovering, but far below target |
| Process shape | Centralised, standardised, one clock | Distributed across sites, many local handoffs |
| Where the days go | Contained and predictable | Contract, capacity, and confirmation delays at site |
The regulator has largely fixed its part. The centralised combined review runs at 98%, and the end-to-end 150-day measure is closing. The stubborn gap now lives in the space between approval and an open, recruiting site, where the work is distributed across many organisations and coordinated through email, spreadsheets, and local trackers.
My Review: What I Make of This Data
I shared a short reaction to this release on LinkedIn when it landed. The full view follows below.
I read this release as good news wrapped around an uncomfortable truth. The good news is that the reforms aimed at the regulatory front door are working. A 98% combined review figure held all year is a serious achievement, and a 150-day median that has fallen from 169 days to 122 in about a year tells me the national focus on commercial trial set-up is landing where it was aimed. Anyone who argued the MHRA was the bottleneck should look again. On this data, it is not.
The uncomfortable truth is that indicators 3 and 4 have barely a national lever left to pull. A first-participant-within-30-days rate that has sat below target every year since 2017 is an operational problem, not a regulatory or funding one. The days disappear inside local set-up: costing and contracting, confirmation of capacity and capability, green light, pharmacy set-up, and the final scheduling of the first participant. Every one of those steps lives at site level, and most of them are still coordinated through disconnected tools.
I want to be careful with the small numbers here. Indicator 1 rests on a handful of studies a month, and the indicator 3 and 4 splits sometimes come down to four or six studies in a category. The authors are right that the honest read is the six-to-twelve-month trend. That caution applies in both directions. One weak month is not a crisis, and one strong month is not a victory.
The other point worth sitting with is what indicator 5 proves. An 82% recruitment-to-time-and-target figure, held above the 80% bar since mid-2023, says the delivery network and the sites are good at the actual work of recruiting. The constraint is the time and the unpredictability of getting from an approval letter to an open door. We have a system that runs well once it starts and struggles to start on time.
The regulator changed. The local set-up process did not.
My Guidance: Where the Work Sits Now
For sponsors, sites, and hub teams reading this, my practical guidance is to treat local set-up as the measurable stage it now clearly is.
- Instrument the 60-day and 30-day windows directly. The national KPI reports six months late by design. A live view of days-since-HRA-approval and days-since-open for every study lets a team act inside the window rather than reading about the miss two quarters later.
- Attack the handoffs, not the people. The delay lives in the gaps between costing, contracting, capacity confirmation, and green light. Each handoff coordinated by email is a place a study waits. A shared, dated record of where each study sits removes the waiting that no individual owns.
- Make site set-up status visible to the sponsor in real time. Much of the 60-day slippage is a sponsor waiting on a site, or a site waiting on a document, with neither able to see the other. A connected view converts an opaque process into a managed queue.
- Separate the studies that were never going to be fast. Rare-disease and low-recruitment studies distort a raw local figure. Track them apart so the fixable delays stand out from the expected ones.
- Report on the trend, not the month. Adopt the report’s own discipline internally. Judge set-up performance on rolling six-month data, and hold the improvements you make against that line.
None of this needs a new regulation. It needs the local set-up stage to be as visible, dated, and governed as the regulatory stage already is.
How Does AQ Support Predictable Study Set-Up?
The gap this data exposes is exactly the gap connected clinical research operations are built to close. AQ Trials runs study set-up and oversight as one connected record rather than a chain of disconnected tools.
The CTMS holds a live, dated view of every study’s set-up milestones, so days-since-approval and days-since-open stay visible while a team can still act on them, not six months later. The electronic Investigator Site File (eISF) keeps site-level essential documents and set-up status current and shared, so a sponsor sees where each site actually stands and the confirmation-of-capacity handoffs stop waiting in inboxes. Set-up, documentation, and oversight sit on one system, so the local delays that indicators 3 and 4 measure become a managed queue with named owners rather than an opaque delay that only surfaces in a national report two quarters on.
Delivery, on this data, is already strong. The opportunity is in making the start as predictable as the finish. Book a live demo to see how AQ Trials makes study set-up visible, dated, and governed from approval to first participant.
Frequently Asked Questions
What are the UK clinical research delivery KPIs?
They are a shared set of measures from the NIHR and the MHRA that track the speed and predictability of regulatory approval and study set-up across UK clinical research. The June 2026 release covers seven indicators, from combined review timelines to recruitment to time and target.
What is a good study set-up time in the UK?
The KPIs set two local targets: opening to recruitment within 60 days of HRA approval, and recruiting a first participant within 30 days of opening. For commercial contract trials, the end-to-end ambition is 150 days from regulatory application to first participant.
Is the MHRA the bottleneck in UK trial set-up?
The data says no. Combined review, run jointly by the MHRA and a research ethics committee, sat at 98% against a 99% target in April 2026. The larger delays now sit in local site set-up after approval.
What is the 90-day site-level target?
A site meets the 90-day target when it recruits its first participant within 90 days of either receiving regulatory approval or being selected as a site, whichever occurs later. The UKCRD describes it as the site-level part of the wider 150-day target, and reports performance against it trust by trust every month.
How often are the UKCRD KPIs updated?
The national indicators are published monthly on GOV.UK, and the trust-level set-up report is published monthly by the UKCRD. Both carry a built-in reporting lag. Most indicators publish around six months behind the current date to allow sponsors and sites to enter their data, so recent months continue to fill in over time.