The published evidence does not answer this question directly. No study has measured source data verification (SDV) hours at a site before and after it moved to eSource. The literature quantifies two neighbouring things instead: what full SDV costs a trial, and how much data entry time eSource removes at the point of capture.
Those two figures are useful, and they are frequently combined into a single claim that neither one supports. This guide sets out the four studies a UK research site is most likely to meet in a vendor deck or a business case, the numbers each one actually reports, and the distance between those numbers and a reduction in SDV. Our complete guide to eSource in clinical trials covers the wider subject, including the benefits and limits this evidence speaks to.
The saving that has been measured and the saving that gets quoted are different quantities.
What Does the Published Evidence on eSource and SDV Measure?
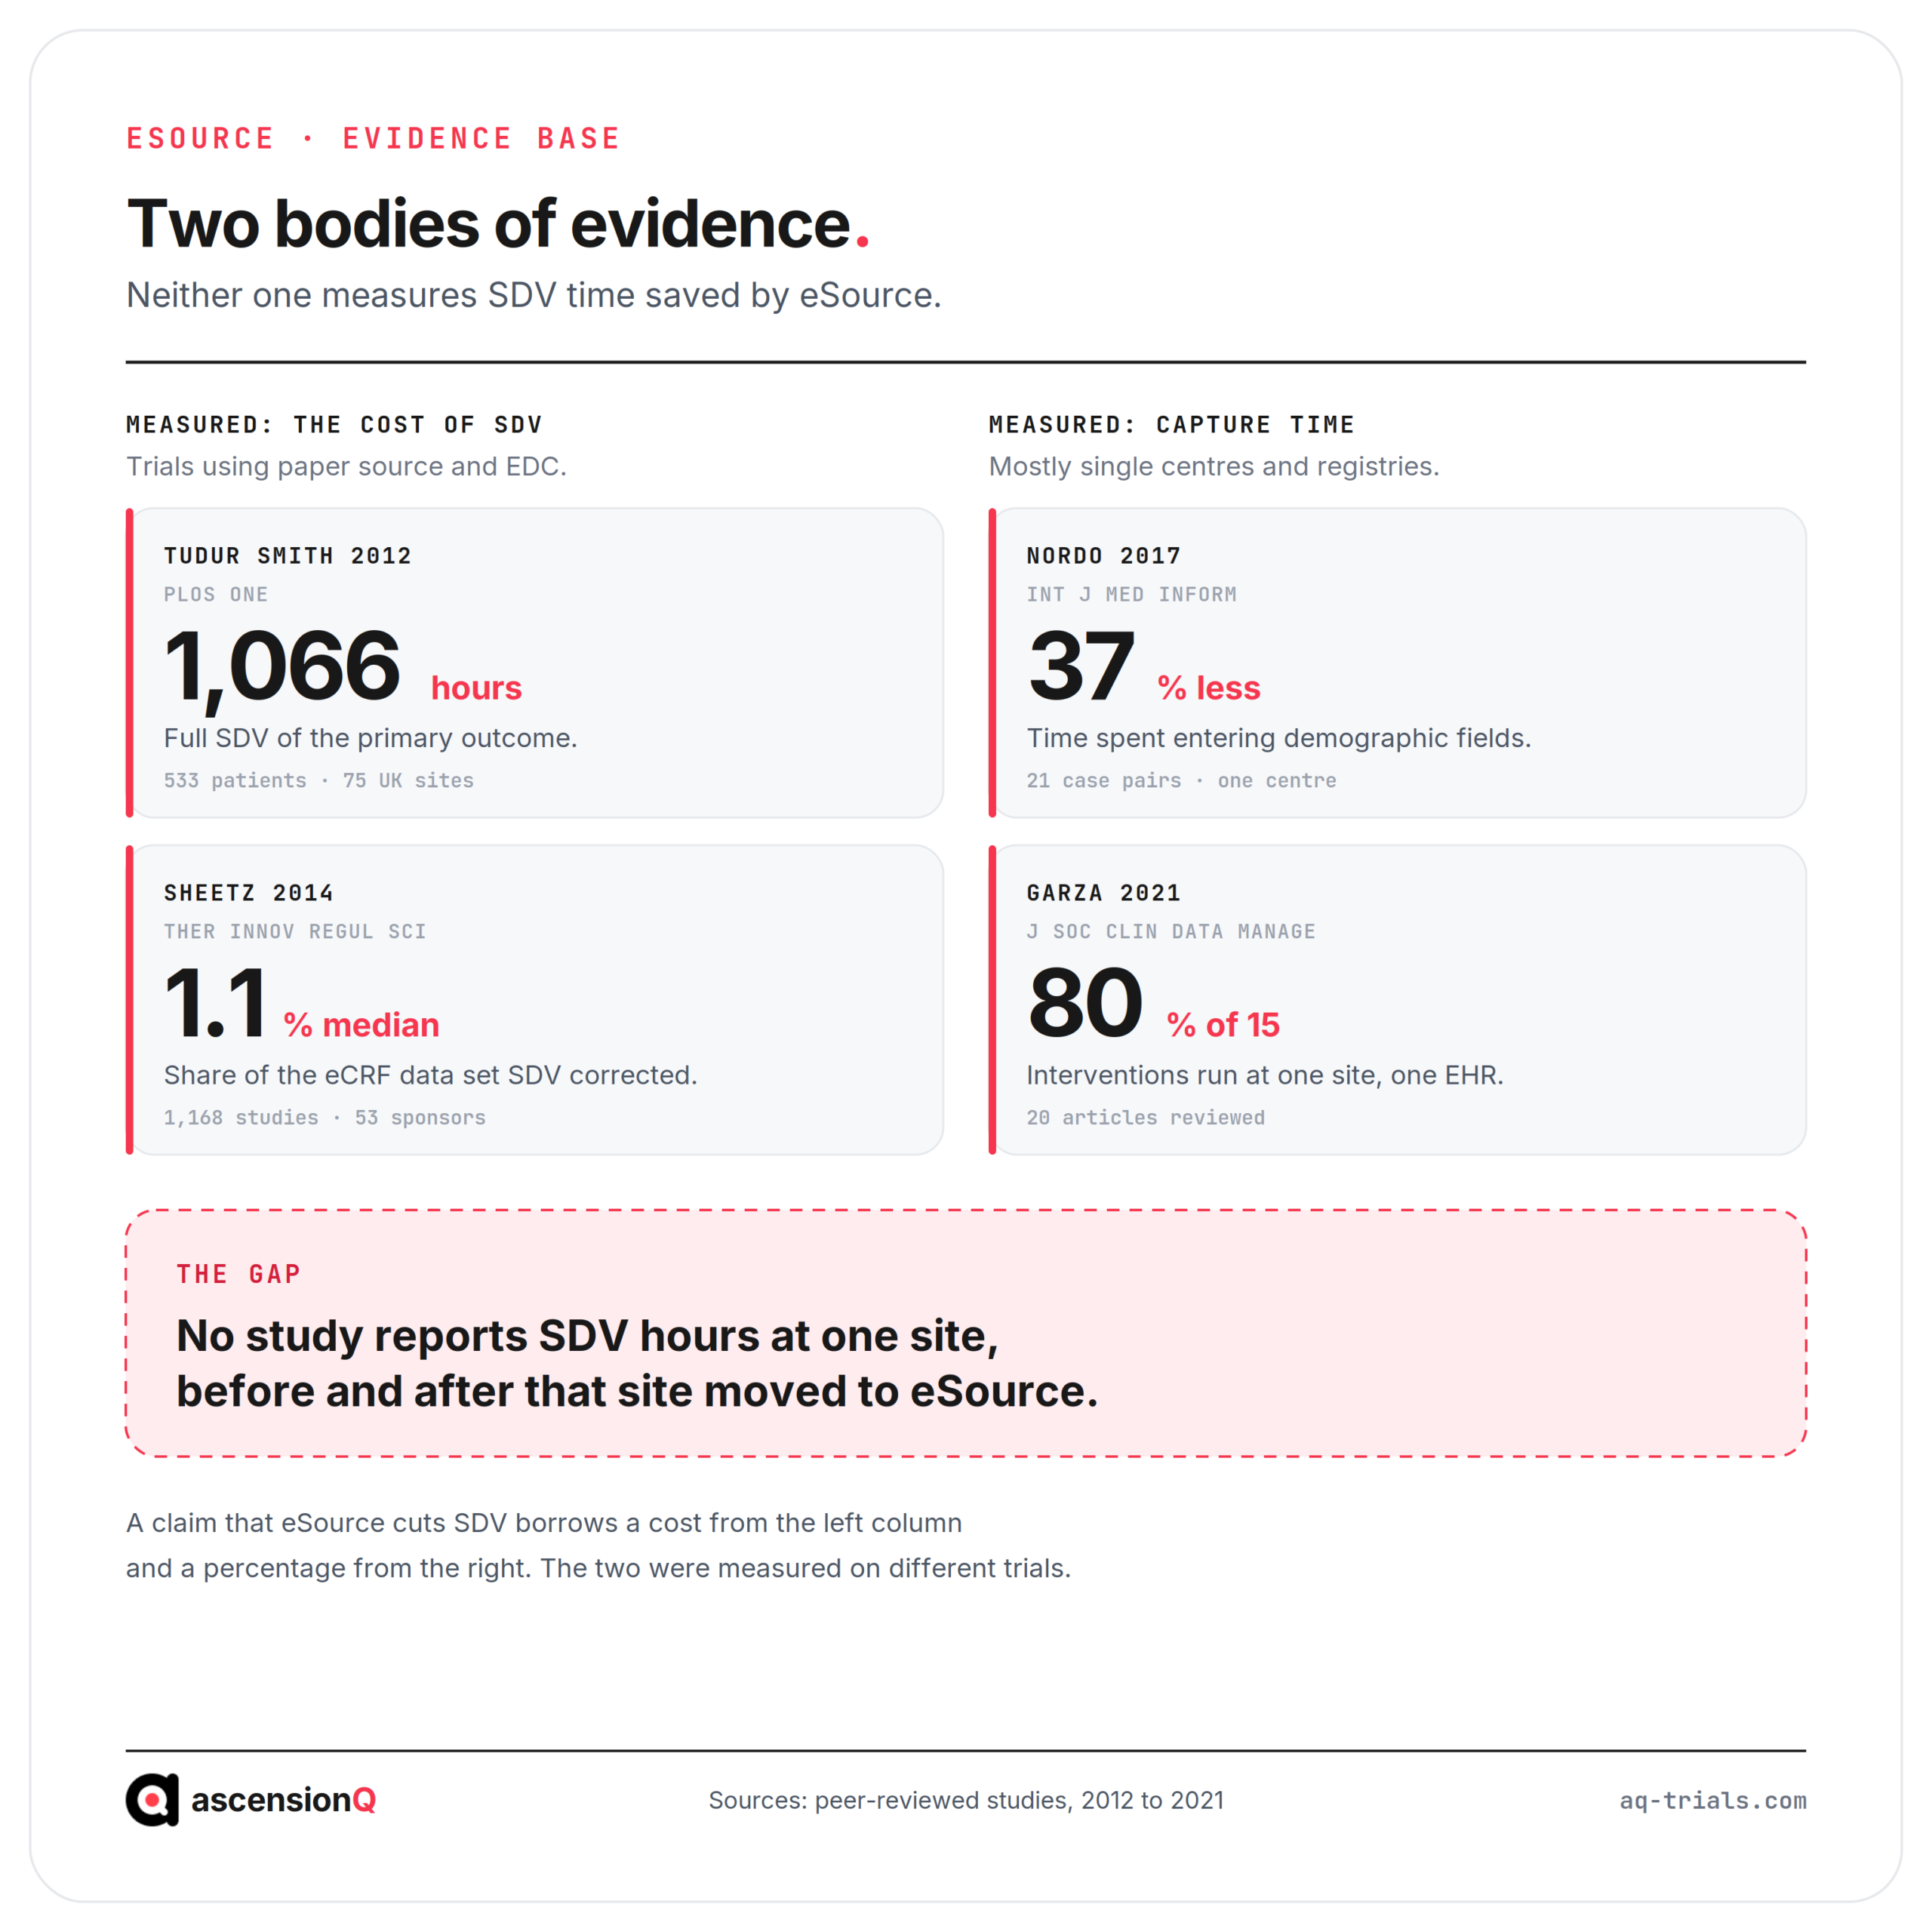
The evidence divides into two groups that were produced for different reasons and rarely appear in the same paper. Each group answers a real question. Neither group answers the question in this article’s title.
- The cost and yield of SDV itself. These studies came out of the risk-based monitoring debate. They measured how many hours and pounds full verification consumes, and how much of the data set it corrects. They were run on trials using conventional paper source and electronic data capture.
- The data capture time eSource removes. These studies came out of health informatics. They measured how long staff take to complete a form with and without electronic source, and how many transcription errors each route produces. They were run mostly at single centres, often on registries.
A claim about eSource cutting SDV borrows a cost from the first group and a percentage from the second. The two were measured on different trials, with different designs, against different baselines.
How Much Time and Money Does Full SDV Consume?
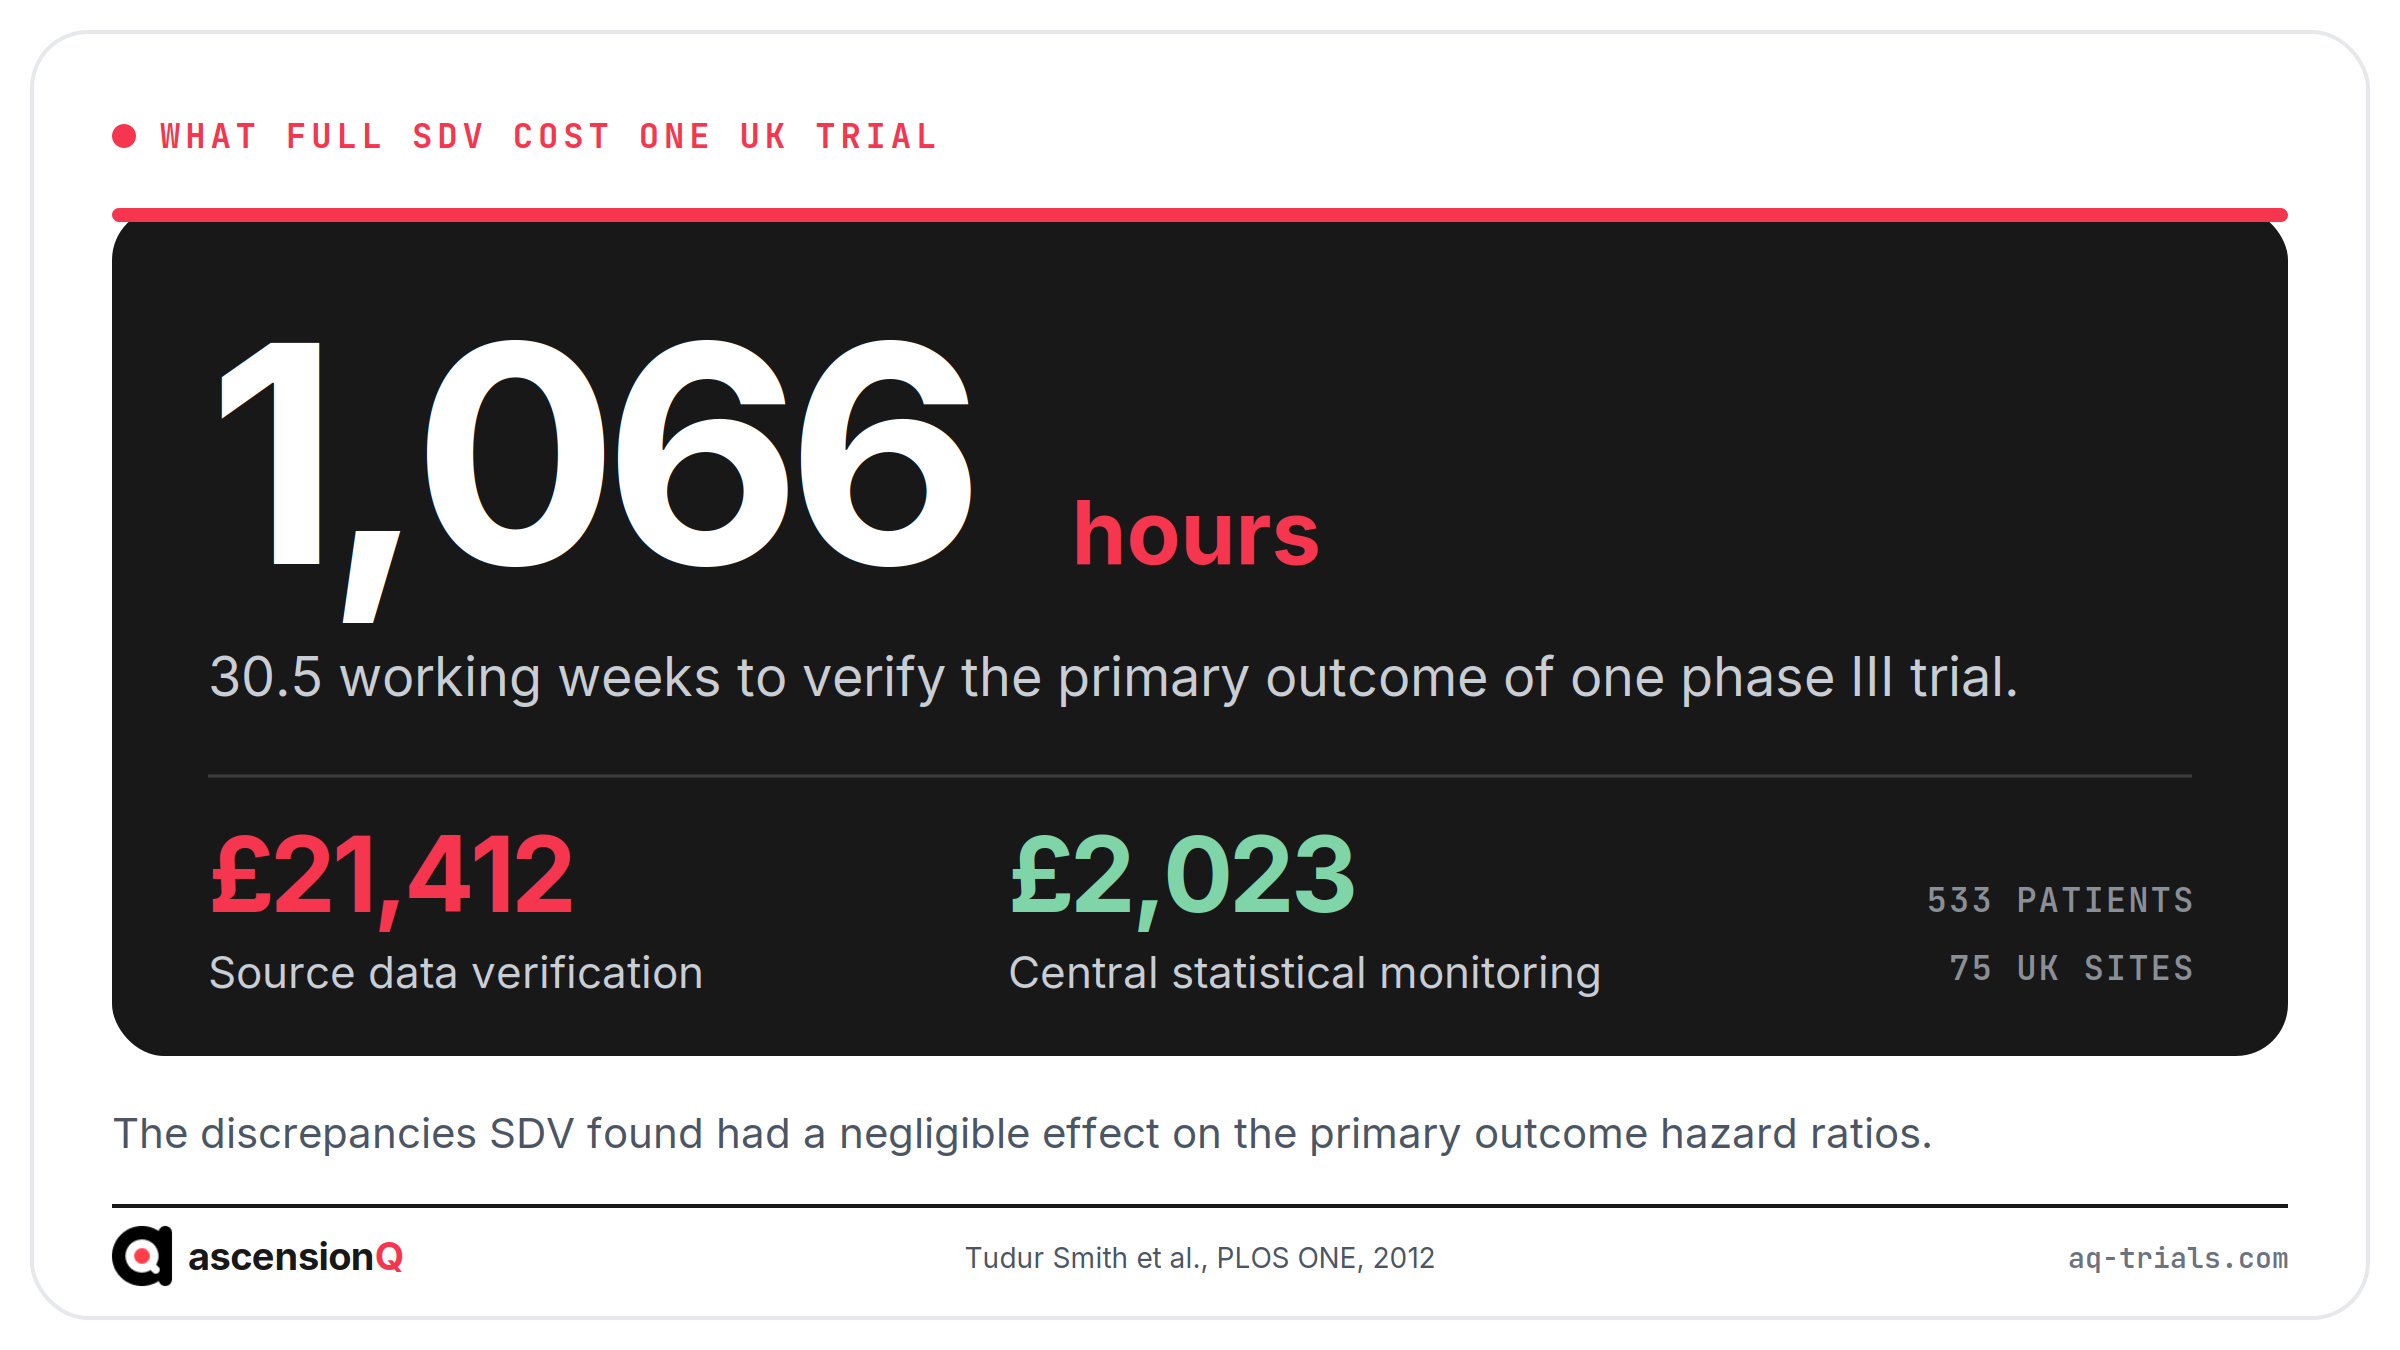
One UK trial put a measured figure on it. Tudur Smith and colleagues examined a phase III cancer trial of 533 patients recruited from 75 UK sites, and reported their analysis in PLOS ONE in 2012.
- Complete SDV of the primary outcome was estimated at 1,066 hours, equivalent to 30.5 working weeks.
- The conservative cost estimate was £21,412 for SDV, against roughly £2,023 for central statistical monitoring of the same trial.
- Date of death differed for 2.4% of participants, and a further 5.4% had deaths identified only through SDV.
- Derived progression-free survival time differed for 24.8% of patients, with a median difference of 0.1 months.
- The discrepancies had a negligible effect on the primary outcome hazard ratios, and the trial’s conclusions held.
A much larger analysis reached the same direction of travel. Sheetz and colleagues, working with TransCelerate, examined 1,168 studies across 53 sponsors and published the results in Therapeutic Innovation & Regulatory Science in 2014. SDV corrected a median of 1.1% of the electronic case report form data set. About 3.7% of that data was corrected after initial entry by any method, and SDV accounted for 32% of those corrections. The authors concluded that SDV should no longer be the foremost quality management method used in clinical trials.
Both figures describe conventional monitoring. They make the case for verifying less, and they say nothing about the capture method at the site. The scheduling and resourcing of the monitoring visits behind those hours sit in the site’s clinical trial management system.
How Much Data Entry Time Does eSource Save at the Site?
The cleanest measurement comes from a time and motion study. Nordo and colleagues observed 21 matched case pairs at a single centre and published the results in the International Journal of Medical Informatics in 2017. Observers recorded keystrokes, mouse clicks and video of research staff completing registry data collection.
| Measure | With eSource | Without eSource |
| Demographic data entry per case | 133 seconds | 213 seconds |
| Total data capture per case | 1,603 seconds | 1,754 seconds |
| Transcription errors in captured fields | 0% | 9% |
The demographic saving was 37%, with a 95% confidence interval of 27% to 47% and a p value below 0.001. The total capture difference of 151 seconds per case did not reach statistical significance, at a p value of 0.051. That contrast is the most important detail in the whole literature. The large saving sat in the fields that could be pulled from a record that already existed, and the study as a whole did not demonstrate a significant reduction in overall capture time.
An earlier German pilot reported a similar shape of result. Between 48% and 69% of study data was prepopulated from the hospital record, which produced a reduction of almost five hours in data collection time. The transcription step these studies remove is the boundary described in our guide to where source data ends and the CRF begins.
Also Read: eSource vs Paper Source Worksheets: What Changes at the Site
Does eSource Reduce the Amount of SDV a Study Needs?
The amount of SDV a study receives is set by the sponsor, in the monitoring plan, on the basis of a risk assessment. The site’s capture method is one input to that assessment. It is not the decision.
- The sponsor’s risk assessment identifies critical data and processes, and the monitoring plan then fixes how much of each is verified.
- ICH E6(R3) directs sponsors towards a risk-proportionate approach, which moves effort away from blanket 100% verification.
- eSource changes what the monitor reads, because the monitor opens the original record rather than comparing a CRF entry against a separate original.
- Remote access changes where the monitor works, and it leaves the number of fields in scope unchanged.
- Removing the transcription step removes one class of discrepancy, which affects what verification finds rather than how much of it is planned.
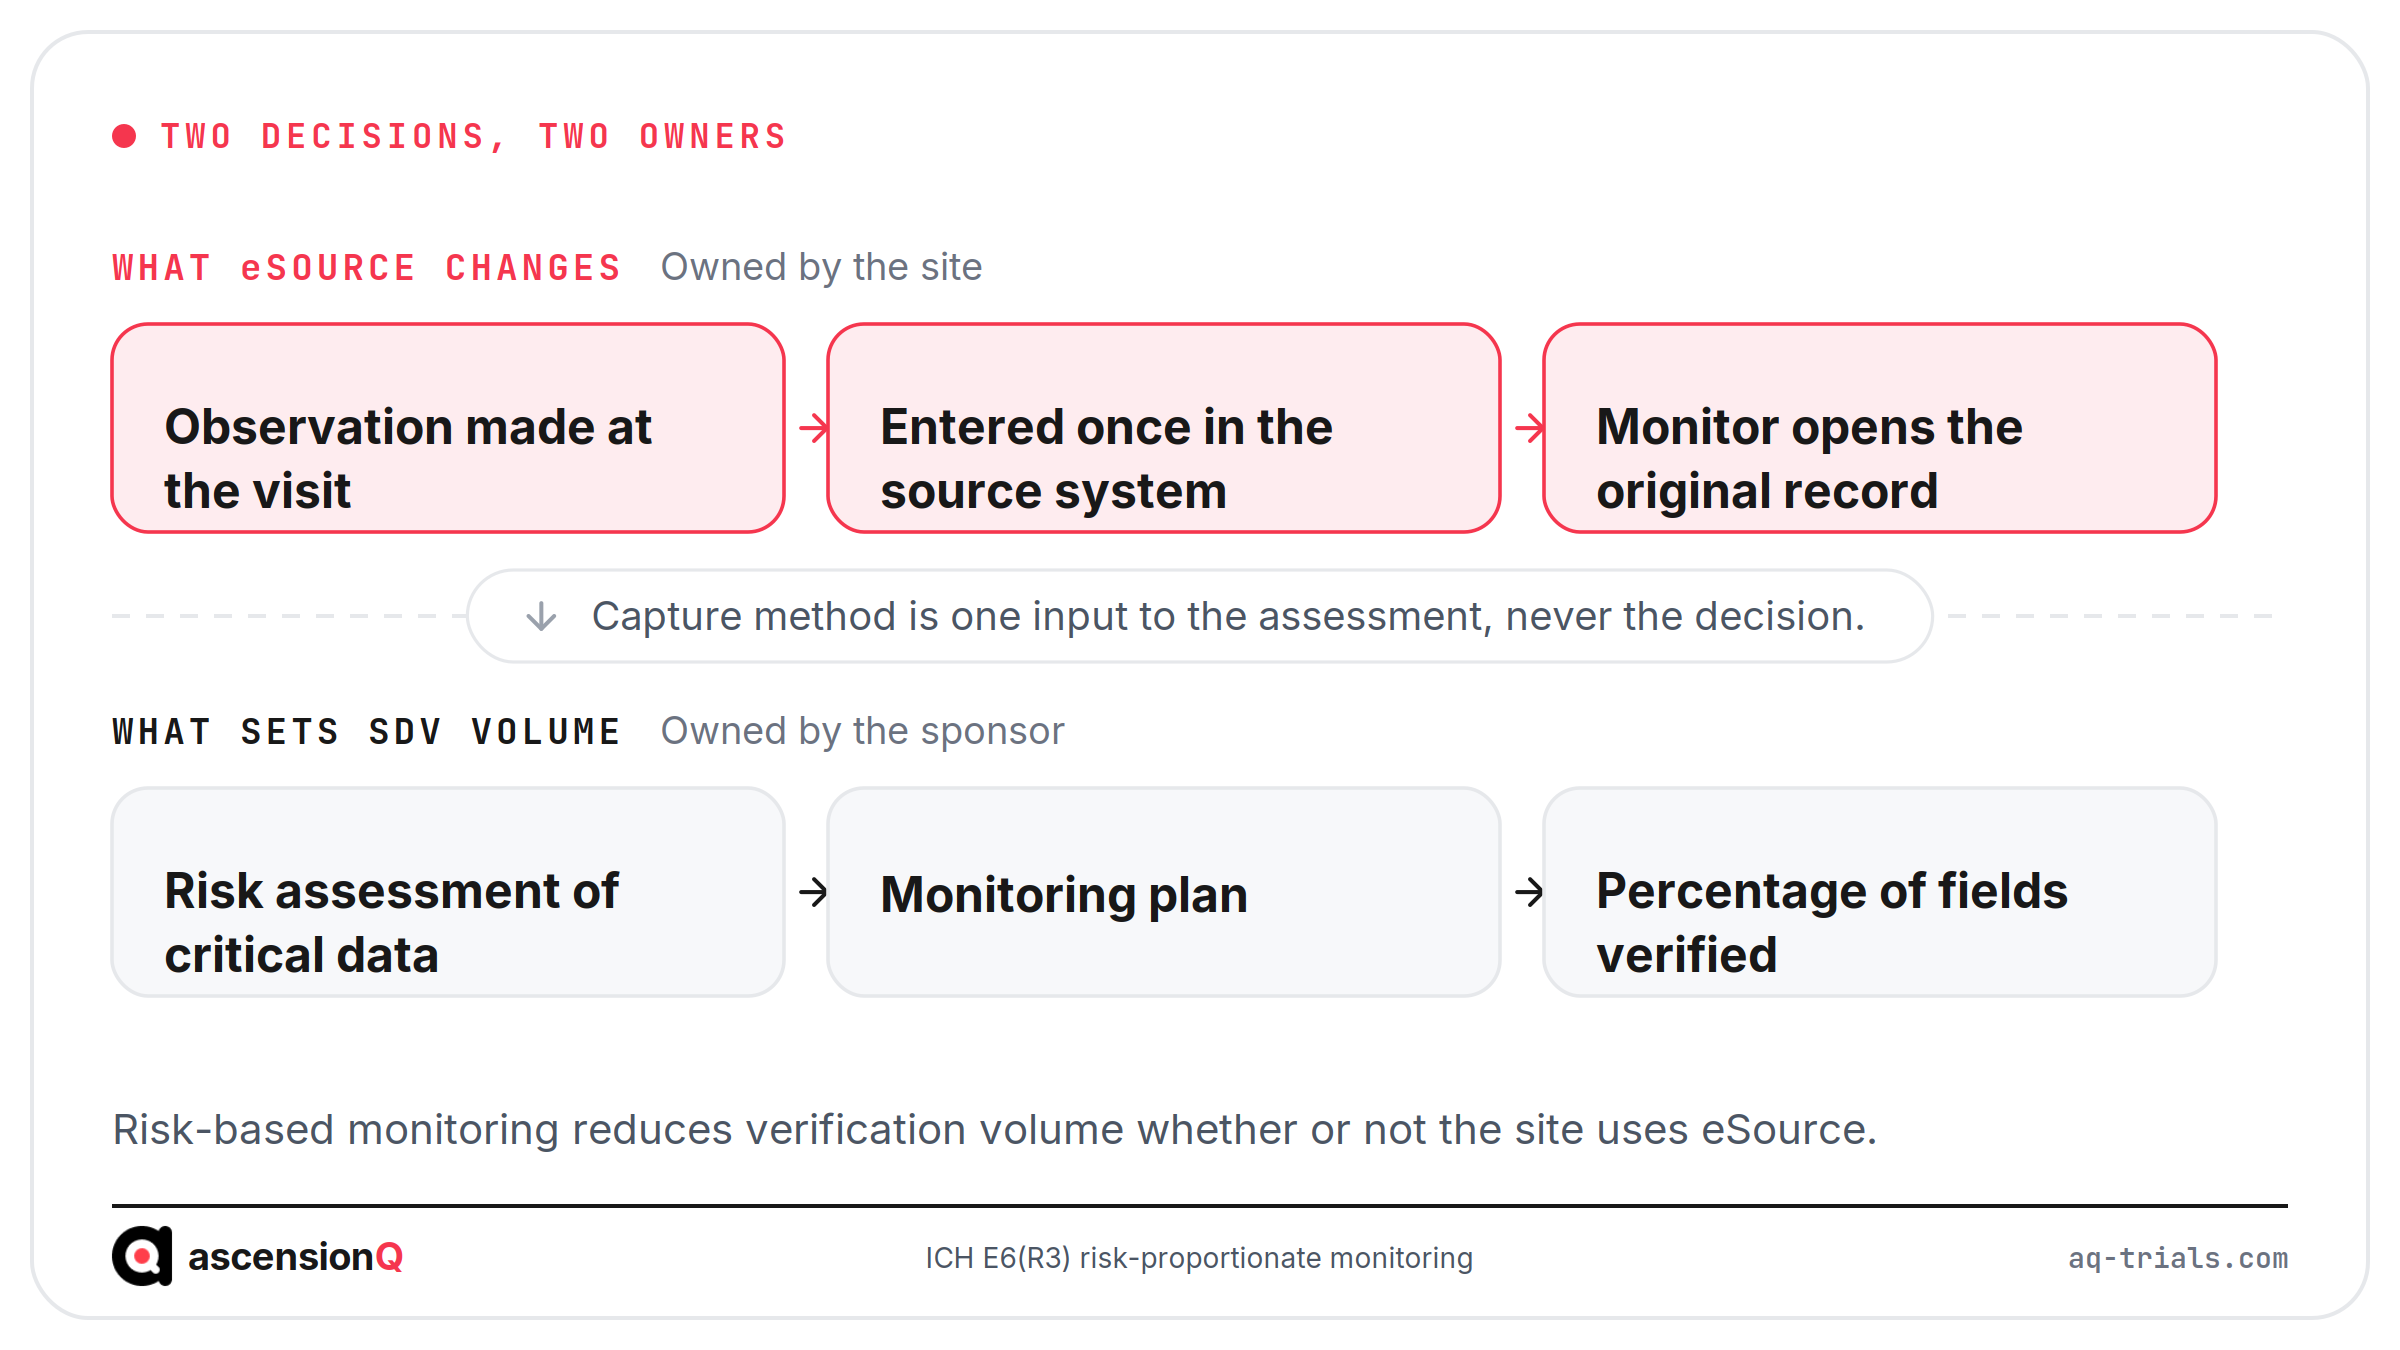
Two changes therefore run in parallel and are often collapsed into one. Risk-based monitoring reduces the volume of verification, and it does so whether or not the site uses eSource. eSource changes the mechanics of each verification event. The access scoping and query flow behind that change are covered in our guide to how monitors do remote source data verification with eSource.
How Reliable Is the Evidence Base Behind These Figures?
The evidence base is thin, and the people who assembled it say so. Garza and colleagues reviewed the field for the Journal of the Society for Clinical Data Management in 2021. They identified 20 articles describing 15 unique eSource interventions.
- 80% of the interventions ran at a single site with a single electronic health record, and only 20% covered multiple sites or multiple records.
- Most implementations used older data exchange standards rather than current ones.
- Quality evaluation across the studies was inconsistent or weak, and several implementations were never rigorously assessed.
- The reviewers described clinical trial data collection as the most difficult and least demonstrated use case in the field.
Three consequences follow for a UK research site reading a figure. A result produced at one hospital with one electronic patient record may not transfer to an NHS trust running a different system under different information governance. A registry study collects a smaller and simpler data set than a regulated interventional trial. A percentage published without its denominator cannot be checked at all.
Also Read: EHR-to-EDC Integration vs Site eSource: Which Suits an NHS Trust?
What Should a UK Research Site Put in a Business Case?
A business case survives scrutiny when every figure in it carries a citation and a scope. The table below separates the claims the published evidence supports from the claims it does not.
| Claim in the business case | What the evidence supports |
| “eSource will cut our SDV by a set percentage” | No published study supports a figure of this kind. SDV volume is fixed in the sponsor’s monitoring plan. |
| “eSource removes transcription errors between the worksheet and the CRF” | Supported. One study recorded 0% transcription errors with eSource against 9% without. |
| “eSource saves about a third of the time spent entering demographic fields” | Supported for fields drawn from an existing record, in a single-centre study of 21 case pairs. |
| “Full SDV is expensive relative to what it finds” | Supported. One trial needed 1,066 hours for its primary outcome, and SDV corrected a median 1.1% of the data set across 1,168 studies. |
| “Our site will see the same figures” | Unproven. Most published implementations ran at one site with one electronic health record. |
Local measurement closes the gap that the literature leaves open. Three measures are practical to record at a UK site, and each one produces a number the site owns.
- Time from the visit to the data being available to the sponsor, sampled before and after the change.
- Queries raised per participant, split by whether the query arose from a transcription step.
- Monitoring hours per visit, recorded against the percentage of fields the monitoring plan puts in scope.
Those three measures answer the question the published literature has not yet answered, for one site, with its own case mix and its own sponsors. A site that records them from the first study builds the comparison that no vendor can supply.
Frequently Asked Questions
How much SDV time does eSource save?
No published study has measured it directly. The evidence quantifies two neighbouring things instead: what full source data verification costs a trial, and how much data entry time eSource removes at capture.
Does eSource reduce the amount of SDV a study needs?
The sponsor sets the amount of SDV in the monitoring plan, based on a risk assessment. The site’s capture method is one input to that assessment, not the deciding factor.
What should a site put in a business case for eSource?
Only figures that carry a citation and a scope. Claims the published evidence supports should be kept separate from claims it does not.
Sites weighing these figures will want to see a system before committing to any of them. Book a live demo to see the AQ platform today.